Node-RED on the Raspberry PLC: flows, I/O and MQTT dashboard
Lesson 5: Node-RED on the Raspberry PLC
Node-RED lets you build automation logic by wiring nodes in a browser instead of writing code. On a Raspberry PLC it is a fast way to read I/Os, talk Modbus or MQTT, and publish a dashboard for the operator. In this lesson you build three flows of increasing complexity, from a first "hello" flow to a dashboard connected to an MQTT broker.
By the end of this lesson you will be able to:
- Explain nodes, flows and messages, the three concepts behind every Node-RED application.
- Read and write the digital and analog I/Os of the PLC from a flow.
- Build a dashboard that publishes and subscribes through an MQTT broker.
- Secure the Node-RED editor before taking it to a plant.
1. What is Node-RED?
Node-RED is an open source visual programming tool. You create flows by connecting nodes that represent devices, APIs and services, in a graphical interface that runs in the browser. It is widely used in industrial automation, data processing and IIoT, and it is especially good when you have to integrate different devices and services with little or no code.
Three concepts matter:
- Node: the basic building block. It has at most one input and as many outputs as it needs. It runs when it receives a message or an external event (a timer, a click) and may send a message to its output.
- Flow: a space of the editor where you organise nodes and connections and define the sequence of actions of your application.
- Message: the object passed between nodes. It carries the information that nodes use to act, decide or transform data.
2. The objective of this lesson
You will create three flows. The first is an introduction with an Inject, a Function and a Debug node. The second reads and writes the I/Os of the PLC. The third creates a dashboard that uses MQTT as its back end, much closer to a real application.
3. How to install Node-RED
Node-RED is already installed if you ran the install.sh script. Check that it is running:
systemctl status nodered.serviceBefore anything else, the rpiplc C++ library must be installed on your Raspberry PLC (github.com/Industrial-Shields/rpiplc-lib). To use the I/Os from Node-RED you also need the @industrial-shields/node-red-librpiplc package:
cd ~/.node-red
npm install @industrial-shields/node-red-librpiplc
Open Node-RED in the browser at http://<PLC-IP>:1880 (it uses https only if you enabled TLS). The first time you will see the editor:
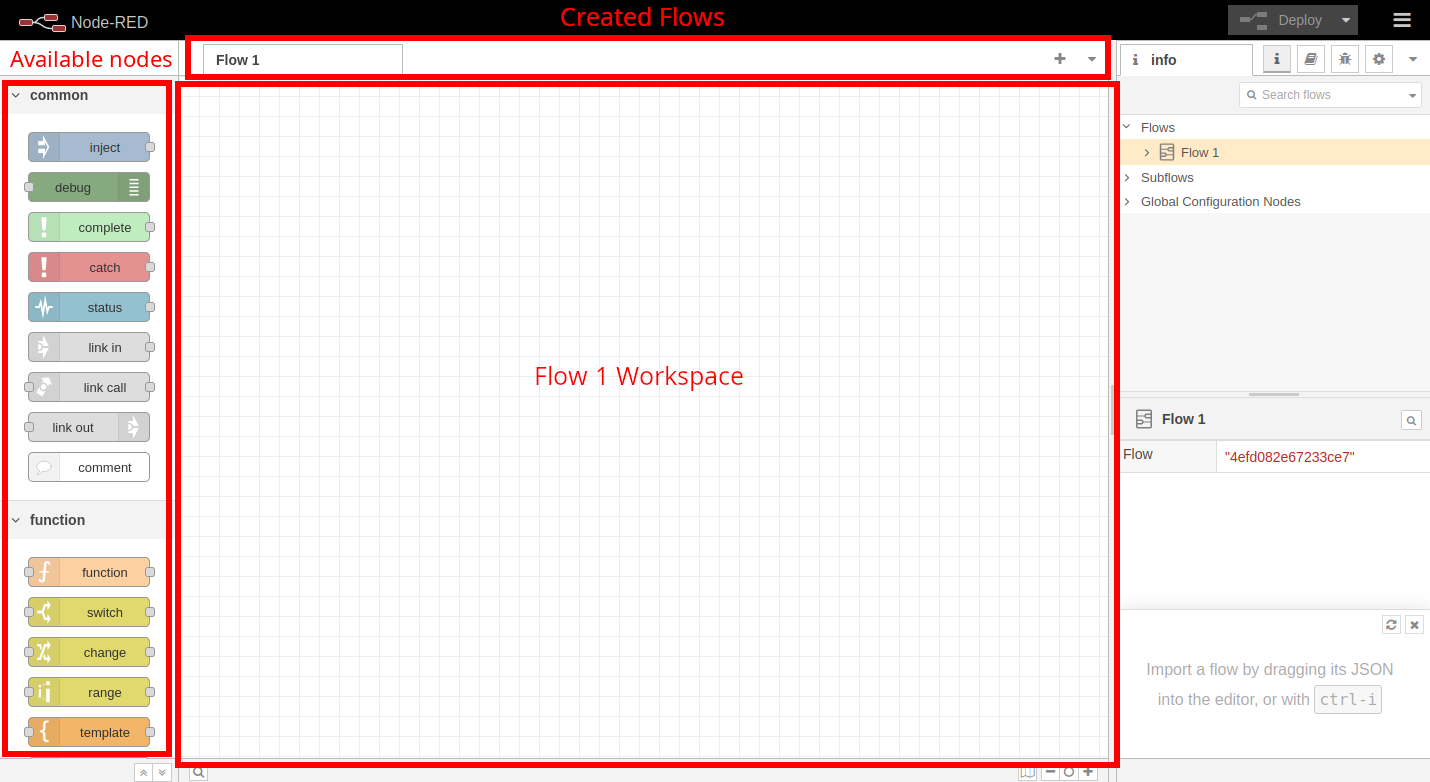
- On the left, the Node Palette holds all the nodes; use the search bar to find one quickly.
- At the top, the tabs organise your flows and subflows, so you can keep one flow per project or scenario.
- In the middle, the Flow Workspace is the canvas where you build and configure your flows by dragging and dropping.
Secure the editor before a real deployment. By default, anyone who can reach port 1880 can edit the flows and therefore control your outputs. In ~/.node-red/settings.js enable adminAuth with a bcrypt-hashed password (the node-red-admin hash-pw command generates it), and keep the port inside the control network, behind a firewall.
4. The first flow
4.1. The goal
You will create a message with the number 0 in its payload. A Function node adds one to it and sends it to a Debug node, which prints the result.
- Inject node: injects a message on a click. Here it injects 0 as payload.
- Function node: runs custom JavaScript on the message. Here it adds one to the payload and returns the message.
- Debug node: displays the messages that reach it in the debug panel.
It looks simple, but it contains the basic building blocks of any more complex automation.
4.2. Building the flow
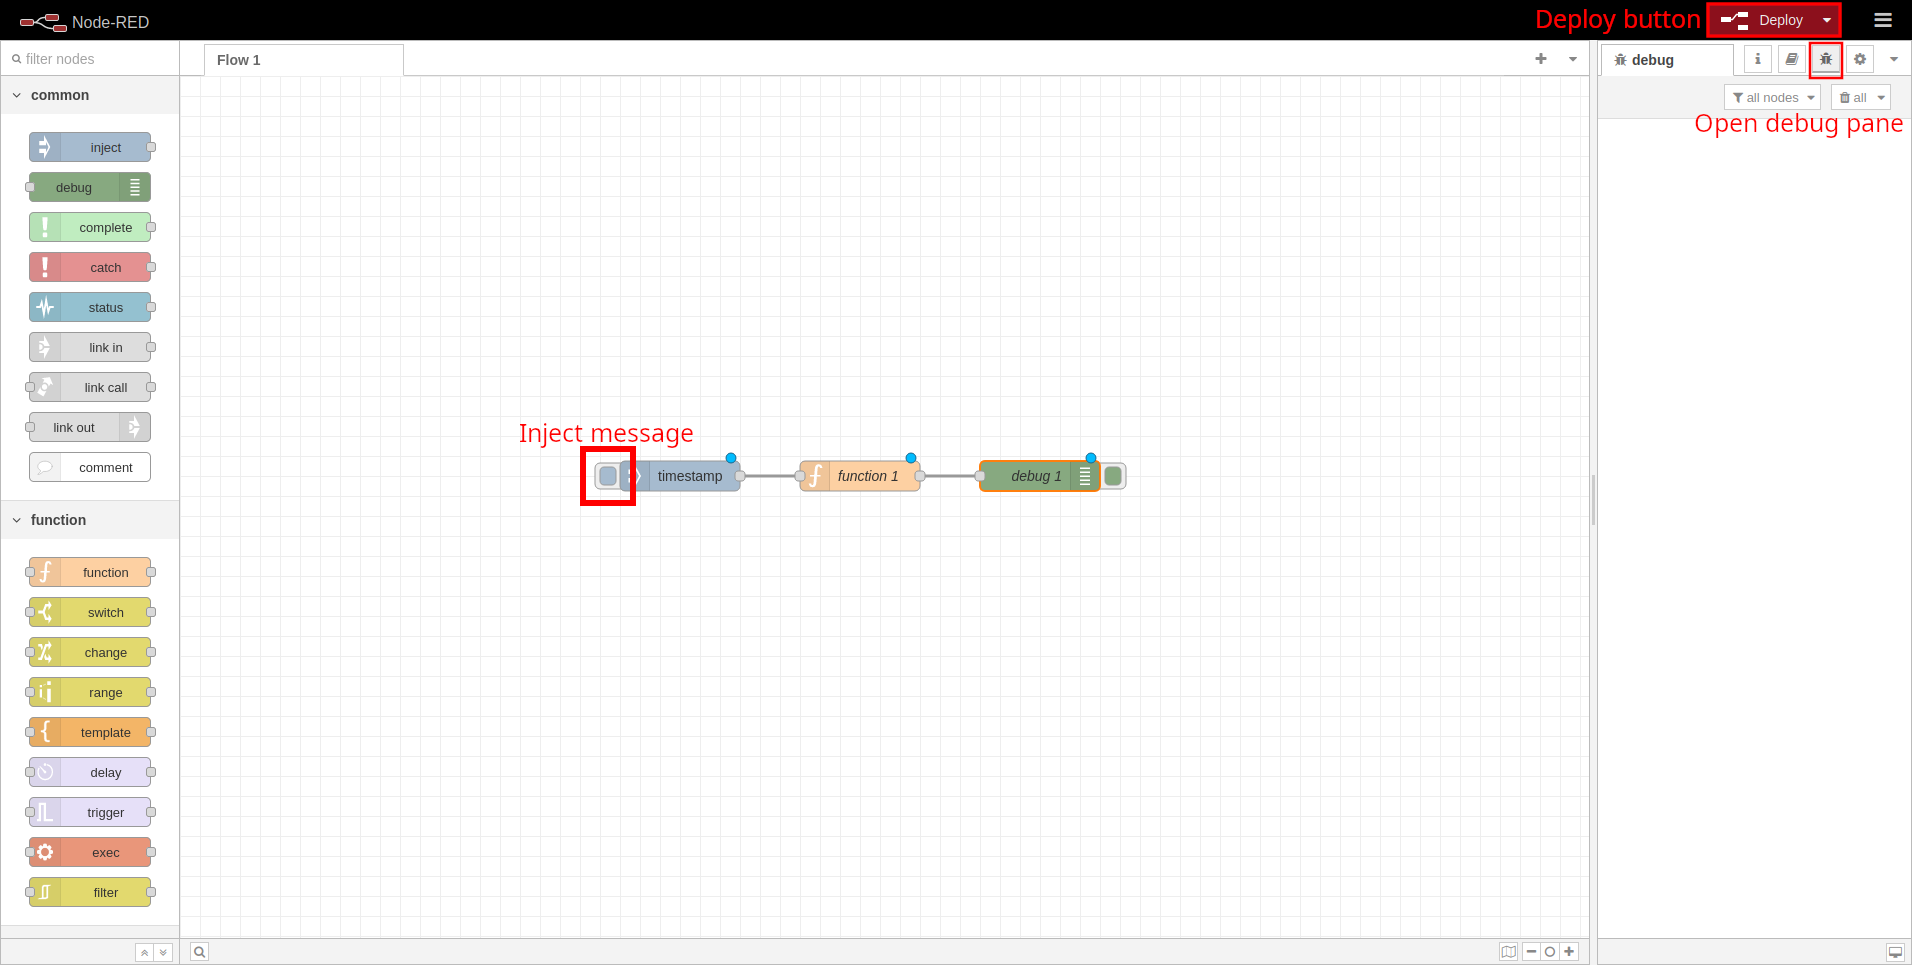
Drag an Inject, a Function and a Debug node from the palette onto the workspace. Connect the output of Inject to the input of Function, and the output of Function to the input of Debug:

4.3. Configuring the nodes
Double-click the Inject node. It sends a message with a topic (empty) and a payload (a timestamp). Open the payload type drop-down, choose number and type 0. The node can also send messages at intervals or with extra properties, which we do not need now.
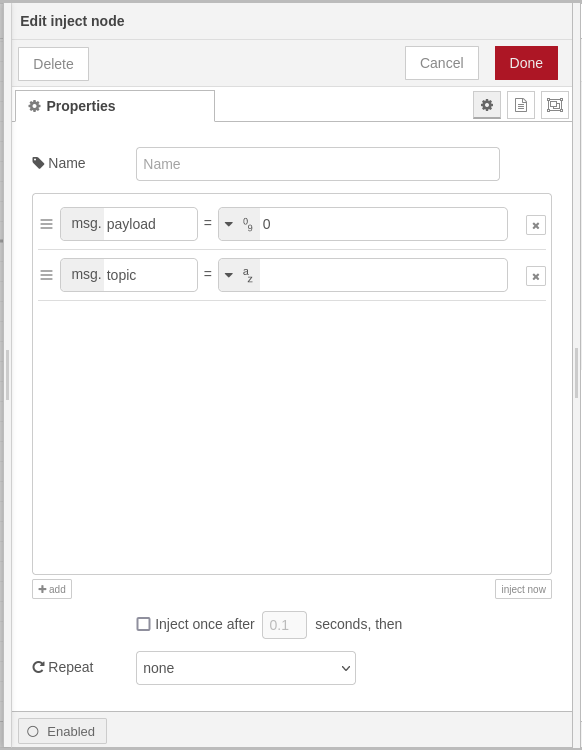
Double-click the Function node. It has four tabs:
- Setup: change the number of outputs and import JavaScript modules.
- On Start: code that runs once when the node starts.
- On Message: code that runs every time the node receives a message.
- On Stop: code that runs when the node is stopped or redeployed.
Put this code in On Message:
msg.payload += 1;
return msg;
The Debug node needs no configuration: it prints the payload by default. Open the debug panel, click Deploy and press the button at the left of the Inject node. You should see a 1 in the right panel.
5. The second flow: PLC inputs and outputs
5.1. The goal
You will read a digital and an analog input and copy their state to the corresponding outputs, printing the values with Debug nodes. It is the same logic as Lesson 2, now without writing code.
5.2. Building the flow
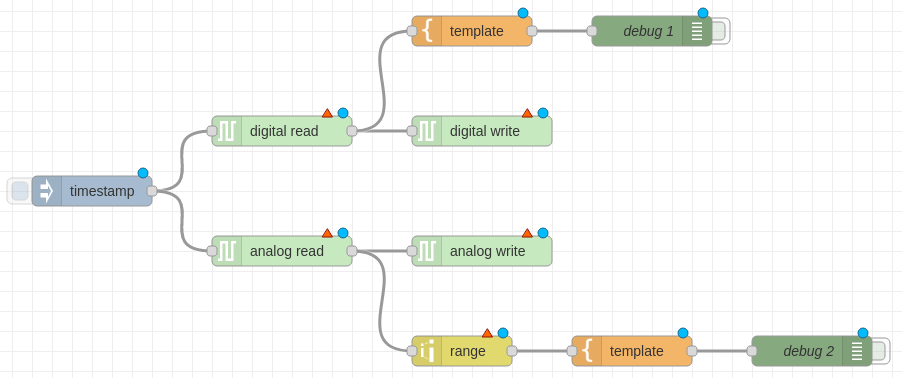
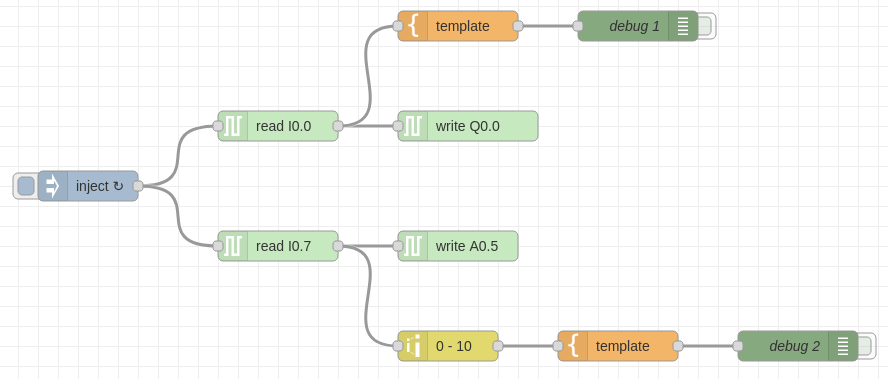
Drag these nodes onto the workspace: 1 Inject, 1 Digital Read, 1 Digital Write, 1 Analog Read, 1 Analog Write, 1 Range, 2 Template and 2 Debug.
The Read and Write nodes come from the node-red-librpiplc package installed at the start of the lesson. A Read node reads the selected input every time it receives a message and sends the result as payload; a Write node sets the selected output to the value of the payload it receives. The Range node scales linearly between two ranges (here, 0-4095 to 0-10 V), and the Template nodes format the payload. Connect them as in the image:
5.3. Configuring the nodes
Set the Inject node to send a message every 5 seconds (select interval in the Repeat box).
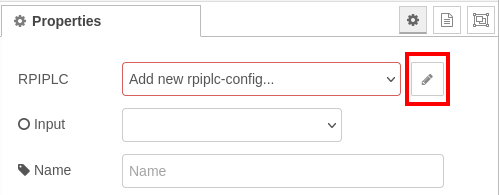
Double-click the Digital Read node. A red box labelled Add new rpiplc-config appears; click the pencil icon next to it.
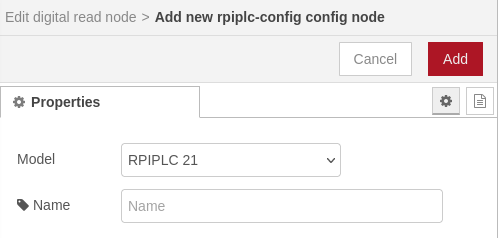
In the empty Model box select your PLC model and click Add.
Now choose the pins of each node:
- Digital Read:
I0.0 - Digital Write:
Q0.0 - Analog Read:
I0.7 - Analog Write:
A0.5
In the Range node map the input range 0 to 4095 to the target range 0 to 10. The Template nodes contain Digital: {{ payload }} (upper) and Analog: {{ payload }}V (lower).
Deploy the flow. The debug panel shows the digital and analog values, and the outputs follow the inputs.
Safety: a deployed flow drives real outputs, so test with the loads disconnected.
6. The third flow: MQTT dashboard
6.1. The goal
You will create a simple dashboard that uses MQTT as its back end. It shows the last message received on the testTopic topic and the time it arrived (in UTC), shows a notification each time a message arrives, and has a button that sends "Hello" to the broker. This is the pattern used to bring PLC data to a plant dashboard.
6.2. Requirements
You need an MQTT broker. Install Mosquitto, an open source broker, on the Raspberry PLC:
sudo apt update && sudo apt upgrade
sudo apt install -y mosquitto mosquitto-clients
sudo systemctl enable mosquitto
Here the broker and Node-RED run in the same PLC, so Node-RED connects to localhost. If other machines will connect to this broker, require user and password as explained in Lesson 1.
6.3. Building the flow
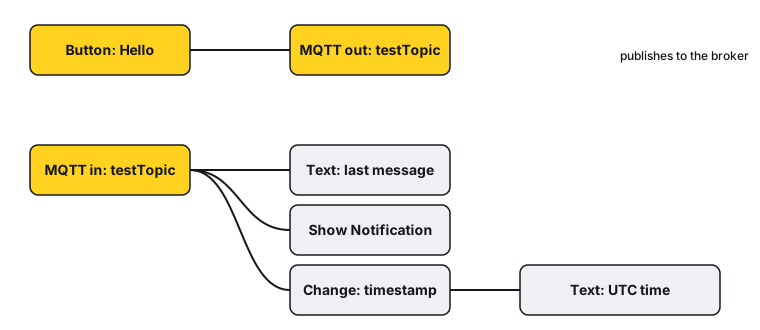
Drag these nodes: 1 MQTT in, 1 MQTT out, 1 Button, 2 Text, 1 Show Notification and 1 Change.
If you do not find Button, Text and Show Notification, install the node-red-dashboard extension: open the menu, choose Manage palette, go to the Install tab, search for node-red-dashboard and install it. A new Dashboard group of nodes appears. (FlowFuse Dashboard, @flowfuse/node-red-dashboard, is the actively maintained successor; its nodes have different names, but the idea is the same.)
The MQTT nodes send and receive the payload, and Node-RED manages the connection to the broker. In the dashboard, the Button node sends a message every time it is clicked, the Text nodes show the payload they receive, and the Show Notification node shows a pop-up with the message. The Change node modifies a payload or adds properties; here it generates the timestamp of the last message. Connect the nodes like this:
6.4. Configuring the nodes
- Button: set the payload to the string
Hello. - MQTT out: Topic
testTopic, QoS 2, Retain true. Click the pencil icon next to Server and configure the broker as in the figure.
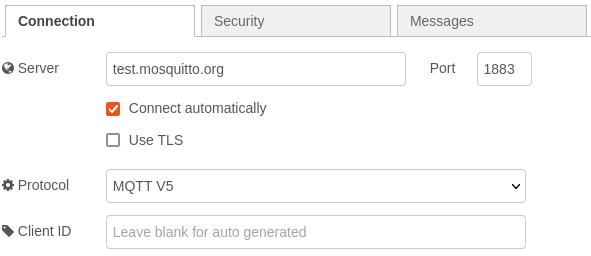
- MQTT in: Action Subscribe to single topic, Topic
testTopic, QoS 2, Output a String. The server is already defined by the previous node. - Change: create two rules as in the figure. The second rule value is
$moment(payload).tz("UTC").format('DD-MM-YYYY HH:mm:ss').
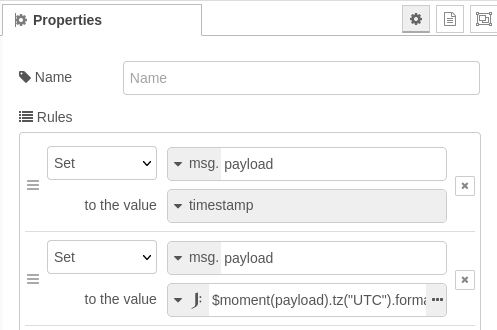
- Text node connected to Change: set Value format to
UTC: {{msg.payload}}. The other Text node and the Notification node can keep their default values.
Deploy the flow, open the dashboard and click the button: the message goes to the broker, comes back through the subscription and appears with its timestamp.
7. Troubleshooting
If Node-RED fails to start from the terminal and reports that the address is already in use (EADDRINUSE, port 1880), an instance is already running, typically the service that starts at boot. Stop it with node-red-stop and run node-red again, or manage the service with sudo systemctl restart nodered.service.
Next step
You have gone from the basics of the PLC to Modbus, MQTT and a dashboard. Combine them to bring field data to your SCADA, and choose the hardware that matches your project in the Raspberry PLC range at www.industrialshields.com.
There are no comments for now.
to be the first to leave a comment.