Case study · Food packaging · ESP32 PLC
An old packaging line. New data at four levels.
A retrofit with the ESP32 PLC: OEE, energy and product data from a line that gave none.
The line still packed food. Its old control could not say how well.
The retrofit added industrial controllers, and stops, energy and products now leave a record.
This case study describes the retrofit of a food packaging line that was becoming obsolete. The owner company and the company that carried out the retrofit agreed on the improvements together. The goals, the four data levels and the results come from the case. The case does not publish the companies, the country, the speeds of the line or any figure. The phases, products and values in the panels are examples.
The challenge
A line that worked, but could not grow or talk.
The goal of the project was to improve the efficiency of the machine and to give it more flexibility for production needs that change all the time. The old control system stood in the way.
Little power, little memory
The old control system had limited processing capacity and memory. New functions could not be added to it.
Not connected
The line had no network link and could not be integrated with other industrial systems. Collecting data and making informed decisions was hard.
No line figures
Energy consumption, running, stop and changeover times, yields per shift and the incidents of each product were not available.
Each product changes the line
Packing one product or another can alter how the line behaves, with more stops or breakdowns. The size of the product or pack and the marking system (label, ink or laser) play a part.
First phase: digitalization
The two companies set four goals for the first phase: data on production, data at line level, data at phase or machine level within the line, and data at product level.
How it works
Three jobs: time the line, find the weak spot, plan the next batch.
Each panel shows one job of the system. Press the buttons. The panels are illustrative simulations: the data levels and the questions are the ones of the case. The phases, the products, the rates, the times and the kWh are examples.
Time the line to get its OEE.
To set OEE indicators on the line, the case needed a set of key data. Specific sensors connected to the PLC now collect it. A typical way to turn those signals into OEE: count good and rejected packs, and log each stop and each product changeover with its start and end. Add stops, add a changeover or slow the line, and watch the OEE of the shift.
- Run, stop and changeover times
- Good and rejected packs
- OEE by shift, from the PLC data
Line events (example)
Illustrative simulation. Example values, not data from the case. Example shift of 480 minutes, ideal rate of 100 packs per minute and 98% good packs. OEE = availability × performance × quality.
Try a full monitored packaging line in the Machine Monitor simulator
Which product, in which phase, stops the line?
One product can make the line stop more often than another. With sensors by phase or machine, the case can now see which combination of product, pack and phase runs best and which one has more incidents. The line level data adds the energy consumption. Pick a product, or compare all of them.
- Stops by phase or machine
- Energy of the line by product
- The weak combination, found in the data
Analysis (example)
Illustrative simulation. Example values, not data from the case. The phases, the products and every number are examples. The case says that sensors by phase or machine show which combination of product, pack and phase runs best or has more incidents.
From the PLC to BI, and back to the plan.
Most of the data is now digital and available in real time. It goes to the central system and into a BI (Business Intelligence) platform. With a view product by product, the team can anticipate much more precisely how long a batch will take. Choose a product and a batch size.
- Real-time data to the central system
- BI view of lines, products and incidents
- Batch times from measured rates
Product
Batch size
Records to the central system (example)
Illustrative simulation. Example values, not data from the case. Rates and changeover times are examples, as if measured by the PLC on earlier batches. The case says that the product by product view lets the team anticipate the packing time of a batch much more precisely.
System architecture
How do you retrofit a packaging line for data?
Keep the line and add industrial controllers. In this case the ESP32 PLC works with sensors, actuators and control devices of the line. It reads specific sensors for production data and sensors by phase or machine. Node-RED links the data with the customer's systems, and the central system feeds a BI platform in real time. The case does not publish the sensors, the energy meter, the network link or where Node-RED runs.
| Signal | Between | Type | Purpose |
|---|---|---|---|
| Pack count | BetweenLine sensors → ESP32 PLC | TypeDigital inputs (typical) | PurposeGood and rejected packs for OEE |
| Line state | BetweenLine and machines → ESP32 PLC | TypeDigital inputs (typical) | PurposeRunning, stop and changeover times |
| Phase or machine sensors | BetweenEach phase → ESP32 PLC | TypeSensor signals (not published) | PurposeStops and incidents by phase |
| Energy consumption | BetweenLine, machine or phase → ESP32 PLC | TypeMeter (type not published) | PurposeEnergy cost by line, machine or phase |
| Product and shift | BetweenProduction order → data record | TypeData (source not published) | PurposeYields by shift and incidents by product |
| Actuators and control devices | BetweenESP32 PLC ↔ line | TypeOutputs and devices (not detailed) | PurposeControl of the line |
| Line data | BetweenESP32 PLC → Node-RED | TypeNetwork link (not published) | PurposeIntegration with other systems |
| Real-time data | BetweenCentral system → BI platform | TypeData (format not published) | PurposeLines, products, speeds, deviations, incidents, breakdowns and stops |
Why it works
Data at the source, and a controller that can grow with the line.
Sensors where the losses happen
The case added specific sensors on the PLC for production data and sensors by phase or machine. That is what shows which product and which phase cause the stops.
Open tools for integration
The case says that a PLC based on open source made integration with other systems easy. Node-RED and the Arduino IDE provided that ease of integration.
Room to grow
The project chose a modular solution, so the specifications can be expanded later. The ESP32 PLC family goes from 14 to 58 I/O and connects expansion modules over I2C.
Real time and history
Production managers see the process in real time and can act at once. The same data feeds the BI platform for OEE targets and improvement actions.
Support along the project
Our team was available before, during and after the installation, by phone, email or WhatsApp.
Learn the pieces
See how an ESP32 PLC reads a meter over Modbus RTU, logs machine data over MQTT without losing it, and how Node-RED collects the data of many ESP32 PLCs.
Hardware
The controller of the retrofit.
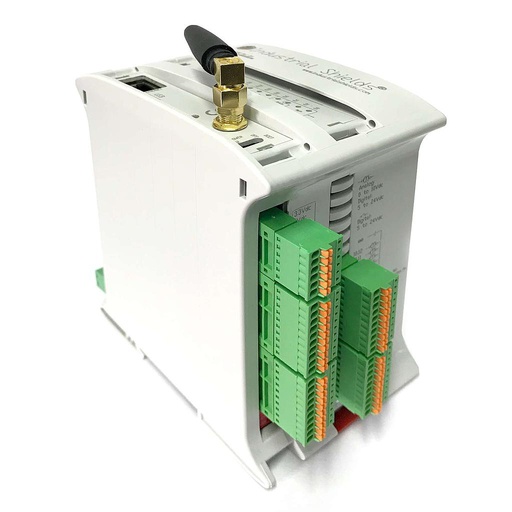
ESP32 PLC
Industrial controllers built on the dual core ESP32, for your DIN rail. On this line the ESP32 PLC works with the sensors, actuators and control devices, and shares the data with the customer's systems.
- Role in this case
- Reads the line and its phases, works with actuators and control devices, shares the data
- Processor
- ESP32 dual core, up to 240 MHz
- Network
- Ethernet 10/100, Wi-Fi 2.4 GHz, Bluetooth LE
- Serial and buses
- RS-485, RS-232, I2C, SPI
- Programming
- C++ with the Arduino IDE
- Family
- ESP32 PLC 14, 19R, 21, 38AR, 38R, 42, 57R and 58; up to 127 expansion modules over I2C
The case does not publish which ESP32 PLC model the line uses, or how many units. The source PDF shows a photo of an ESP32 PLC 21+, and the image here shows the ESP32 PLC 21 FLEX, its current version. Choose the model by the number and type of signals on your line.
Questions about this case
What is a machinery retrofit?
A retrofit upgrades an existing machine or line instead of replacing it. Usually the control and the data side change: new controllers, new sensors and a network link, while the mechanics stay. In this case a food packaging line that was becoming obsolete got industrial controllers, sensors and integration with the customer's systems.
Which data do you need for OEE on a packaging line?
OEE is availability × performance × quality. You need the planned time, the running, stop and changeover times, the ideal rate, the packs produced and the rejected packs. In this case specific sensors connected to the PLC collect the data for the OEE indicators. You can see the idea in the Machine Monitor simulator.
How do you measure energy by machine or by phase?
A typical way: an energy meter on the supply of each machine or phase, read by the PLC over Modbus RTU on RS-485, or by counting the pulse output of the meter. The case says that the energy consumption of the line, its machines or phases is now known, but it does not publish how it is measured. See an ESP32 PLC reading Modbus RTU registers.
Why does the product change the performance of a packaging line?
The same line can behave very differently with one product or another. In this case the size of the product or the pack and the marking system (label, ink or laser) affect the performance. With sensors by phase or machine, you can see which combination of product, pack and phase runs best or has more incidents.
How does PLC data reach a BI platform?
In this case the data goes to the central system and into a BI platform in real time, and Node-RED eased the integration with other systems. A typical way to do it: the PLC sends its data over the network, for example over MQTT, Node-RED collects and checks it, and writes it to a database that the BI tool reads. See a Node-RED concentrator for ESP32 PLCs.
Which PLC fits a machine retrofit?
It depends on the signals you need to read and drive, the links to other systems, and where the controller goes. This case used the ESP32 PLC. The same retrofit approach works with our Arduino based M-Duino PLCs or with the Raspberry PLC, for example when the controller must also run Node-RED or a database. Count the signals first, then choose the model.
Download the case study
4-page PDF with the challenge, the logic, the architecture and the hardware. No form required.
Upgrading a machine or a line?
Tell us what the line does today. An engineer will answer.
Tell us the machine, the control it has now, the signals you can reach and where the data must go: SCADA, ERP or BI. We will propose the PLC, the sensors and the integration.
- You get an answer from our technical team
- PLC, sensors and integration with your systems
- Arduino, ESP32 or Raspberry Pi based PLCs