Case study · Agriculture
Know the grain is fine. Without climbing every silo.
Solar radio nodes read the CO2 of every silo and a PLC sends it to the cloud.
Dozens of silos over a large area. One farmer to check them.
So every silo reports its CO2, and the trips are only for the silos that need them.
This case comes from a real project of an Industrial Shields customer based in Canada, documented in 2020. The customer is not named. The CO2 levels, the solar radio nodes, the 30 minute cycle, the master node, the PLC connected to the cloud, the Python and bash software and the images come from the original case. Silo counts, messages and panel values on this page are examples of a typical way to do it.
From the project
Silos, radio and CO2.
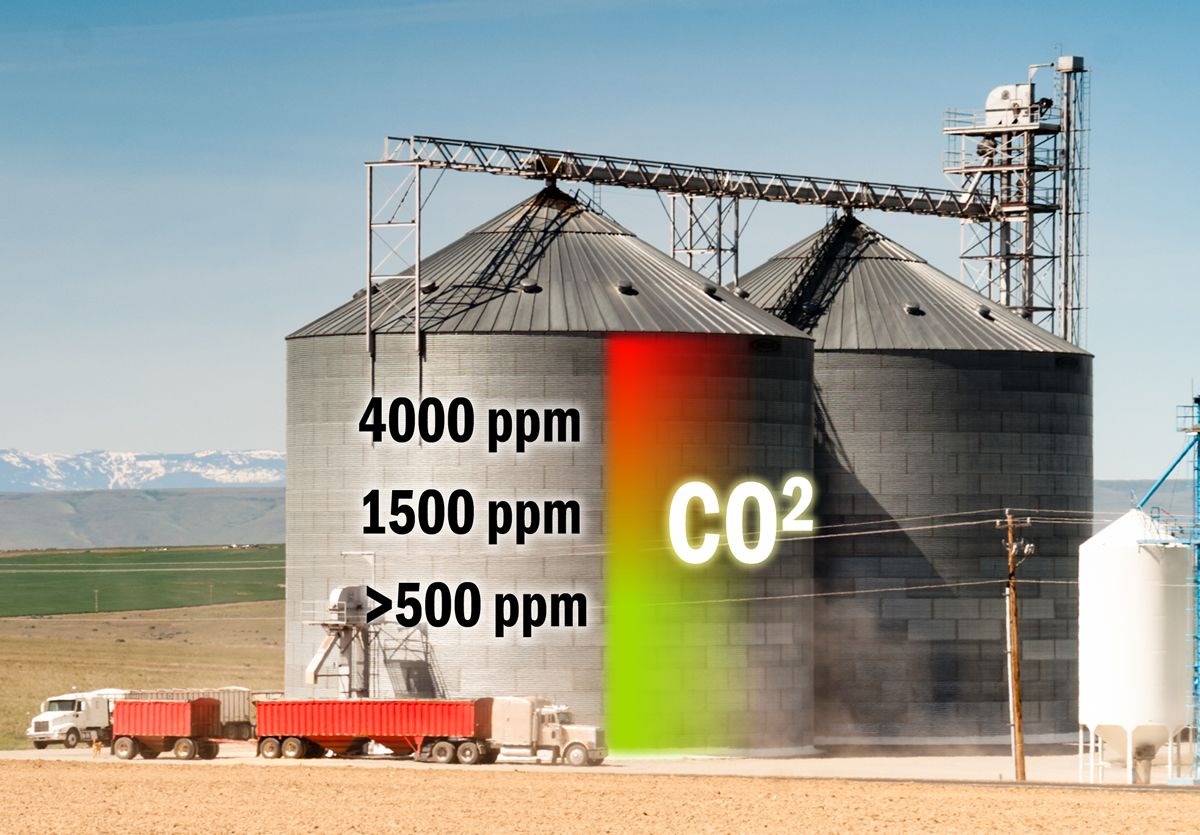
Two images from the original case: the layout of the installation and the CO2 scale that tells the state of the grain.

The challenge
Grain that spoils where nobody looks.
Every year, a large amount of stored grain is lost to fungi and insects. Research in wheat growing areas shows that CO2 is an effective indicator of grain quality. The customer had dozens of silos spread over large areas and checked them by eye, which meant driving to each one. A change inside a silo could go unseen until part or all of the grain was lost, or lost its value.
Measure the CO2
CO2 as the key indicator of the state of the grain, with other sensors on the same nodes.
No wires between silos
One radio node per silo, powered by a solar panel.
A reading every 30 minutes
The nodes read and send to a master, which talks to a PLC connected to the cloud.
Change it without new hardware
Python and bash scripts that are easy to change: reading times, sensors, signals to actuators.
CO2 tells the story of the grain
Ambient air has 350 to 400 ppm. A stable grain mass has 400 to 600 ppm. From 600 to 1,500 ppm, mould is starting. From 1,500 to 4,000 ppm and beyond, there is severe mould or an insect infestation.
How it works
Three jobs: read the grain, keep the nodes alive, watch the farm.
Each panel shows one job of the system. Press the buttons. The panels are illustrative simulations: the CO2 bands come from the case, the readings, batteries and silos are examples.
The CO2 band says what is happening inside.
Each node reads the CO2 of its silo and sends it. The PLC compares the value with the bands of the case: stable grain, mould starting, severe mould or insects. A rise above the stable band is the sign to act before the grain is lost. Try a silo where moisture is getting in.
- 400 to 600 ppm: stable grain
- 600 to 1,500 ppm: mould starting
- Above 1,500 ppm: severe mould or insects
Readings (example)
- Silo 7, last reading 12 min ago.
Illustrative simulation. Example values, no data from the customer. Example values. The bands are the ones in the original case. What to do with the grain (aerate, dry, move or use it first) is the decision of the farmer; the case does not describe it.
Wake, read, send, sleep. The sun does the rest.
The slave nodes wake every 30 minutes, read their sensors, send to the master and sleep. A solar panel keeps each battery charged, and the node can tell in advance when its battery is running low. The master hands the data to the PLC, which sends it to the cloud. Change the weather, then lose the cloud link.
- 48 readings per silo and day
- Solar power, no battery changes
- A warning before a battery runs out
Node and master (example)
- Node of silo 7 asleep.
Illustrative simulation. Example values, no data from the customer. Example values. The case says the nodes are solar powered, need no battery changes and can anticipate running out of battery. It does not publish the battery or the panel.
Try a network of radio nodes: wireless sensor network simulator
Only the silo that changes needs a visit.
With every silo on one screen, the farmer sees at once which one is moving out of the stable band, and drives there only when it is needed. Follow a week on the farm.
- All silos on one screen
- Warnings by band, per silo
- Fewer trips, earlier action
Farm view (example)
- Pick a moment of the week.
Illustrative simulation. Example values, no data from the customer. Example data for 4 silos. The customer has dozens of silos; the case does not publish their readings.
System architecture
How do you monitor CO2 in many grain silos with a PLC?
Each silo has an OpenMote B radio node with a CO2 sensor and other sensors, powered by a solar panel. Every 30 minutes the slave nodes send their readings by radio to a master node, which passes them to a PLC connected to the cloud. Scripts in Python and bash process the data, show it remotely and can drive actuators. In the original layout the radio works at 868 MHz.
| Signal | Between | Type | Purpose |
|---|---|---|---|
| CO2 of the grain | BetweenSensor → node of the silo | TypeSensor on the node | PurposeKey indicator of grain quality |
| Other values | BetweenOther sensors → node | TypeSensor on the node | PurposeThe case says "not only CO2" |
| Readings every 30 min | BetweenSlave nodes → master node | TypeRadio, unlicensed band | PurposeNo wiring between silos |
| All readings | BetweenMaster node → PLC | TypeLocal link | PurposeProcessing in Python and bash |
| Remote view and alerts | BetweenPLC → cloud | TypeInternet | PurposeCheck the silos without driving to them |
| Battery state | BetweenNode → master (typical way) | TypeRadio | PurposeWarn before a battery runs out |
Why it works
Few wires, few trips, one clear number per silo.
One number that means something
CO2 bands tell stable grain, mould starting and severe damage apart, as the research in the case shows.
No cables across the farm
Radio between silos and solar power on each node, so a silo far away costs no trench.
Slow is enough
Grain changes over hours and days, so a reading every 30 minutes is enough and keeps the nodes in low power.
Free to send
The radio works on unlicensed frequencies, with no cost per message.
Room to grow
The nodes have free ports for more sensors or actuators, and the scripts change without new hardware.
Trips only when needed
The case lists the gains: time, fuel, vehicle wear, CO2 emissions and the risk of accidents on the road.
Hardware
Solar radio nodes and a Linux PLC.

Current optionRASPBERRY PLC CPU-Gateway FLEX
The case names a PLC connected to the cloud, programmed with Python and bash scripts, and does not publish the model. A current option for that role is the Raspberry PLC without local I/O: it takes the master node, runs the scripts and sends the data to the cloud.
- Role in this design
- Receives the master node, runs the scripts, sends the data and the alerts
- Compute
- Raspberry Pi 4, quad core 64-bit, 1.5 GHz, 2, 4 or 8 GB RAM
- Ports
- 1 x Gigabit and 1 x 10/100 Ethernet, Wi-Fi, Bluetooth LE, 2 x USB 2.0, 2 x USB 3.0, 2 x RS-485
- Expansion
- One optional board: CAN, LoRa or 4G (LTE-M/NB-IoT or LTE Cat 4)
- Software
- Debian 64-bit preinstalled; runs Python, Node-RED and C/C++
- Power and mounting
- 12 to 24 Vdc, UPS with supercapacitors, real-time clock, DIN rail TS35, IP20, 0 to 50 °C
If the same PLC must also drive fans or other actuators at the site, the RASPBERRY PLC 21 FLEX adds 13 inputs and 8 outputs. Where there is no wired internet, the 4G board gives the cloud link.

OpenMote B (image from the original case)
One OpenMote B per silo, in slave mode, with its sensors and a solar panel. One more node is the master that receives all the silos.
- Sensors
- CO2 and others; the case does not list them
- Cycle
- Read and send every 30 minutes
- Radio
- Unlicensed band; 868 MHz in the original layout
- Power
- Solar panel, no battery changes
- Expansion
- Free ports for more sensors or actuators
OpenMote B is no longer in the Industrial Shields catalogue. The pattern still applies: low-power radio nodes, one master and a Linux PLC. The 868 MHz band is the unlicensed band in Europe; in Canada and the United States it is 902 to 928 MHz, so the radio must match the country.
Questions about this case
Why measure CO2 in stored grain?
Because grain that starts to spoil breathes more. The case quotes past research: ambient air has 350 to 400 ppm, a stable grain mass 400 to 600 ppm, 600 to 1,500 ppm shows mould starting, often because the grain was stored too wet or moisture got in, and 1,500 to 4,000 ppm and beyond shows severe mould or stored-product insects. A rising CO2 shows a problem before it can be seen.
How often should a silo be read?
In this case, every 30 minutes. Grain changes over hours and days, so that is often enough to catch a trend and lets the nodes sleep most of the time on solar power. The scripts let the customer change the reading time.
Which radio band for silos in Canada or the United States?
The layout of the original case shows 868 MHz, the unlicensed band in Europe. In North America the unlicensed band is 902 to 928 MHz. Choose nodes certified for the country, and check the range across the farm before installing. You can try a network of radio nodes, its gateway and lost messages in the wireless sensor network simulator.
Where does the data go, and who gets the alerts?
The master node passes the readings to a PLC connected to the cloud, where they can be viewed and processed from anywhere. A typical way is to raise a warning when a silo leaves the stable band and an alarm above 1,500 ppm. For a Python bridge from MQTT to a database on a Raspberry PLC, see this example, and try remote values and alarms in the remote site telemetry simulator.
How is this different from the sugar beet pile case?
Both use solar or battery radio nodes and a Raspberry PLC. In the sugar beet case the nodes read temperature at the base of outdoor piles every hour. Here they read CO2 inside closed silos every 30 minutes, and the customer is a grain farmer with dozens of silos.
What else can the same nodes do?
The OpenMote B has free ports for more sensors or actuators, and the master collected other data as a test for future improvements. With an output on the PLC side, the same system can drive actuators; the case says the scripts can change the signals sent to them.
Download the case study
4-page PDF with the challenge, the logic, the architecture and the hardware. No form required.
Similar project?
Tell us about your silos. An engineer will answer.
Tell us how many silos or stores you have, how far apart they are, what you want to measure and where the data must go. We will tell you which nodes, which radio and which controller fit.
- You get an answer from our technical team
- Sensors, radio range and the cloud link
- Arduino, ESP32 or Raspberry Pi based PLCs