First steps using Raspberry Pi PLC's
Start following this quick guides
You will know the most useful Raspberry Pi commands, important tips and tricks, and interesting applications of the Industrial PLC's based on Raspberry Pi
Useful Commands
Most useful commands to use your industrial Raspberry Pi or Raspberry Pi based PLC in a safe environment.
Tips and Tricks
Know the important tips and tricks to take into account to use an industrial Raspberry Pi.
Interesting Applications
Want to know what you can use a Raspberry Pi for? Read on to learn more.
Take a look at the basics about Raspberry Pi, in order to start using the PLC without the most common issues.
Connecting a USB Camera to Raspberry Pi PLC
Explanation
Taking Pictures
1. Connect the Raspberry PLC to a WIFi network.
2. Open up a terminal window and issue the following command to install the fswebcam package:
sudo apt update
sudo apt install fswebcam
3. Add your user to the video group:
sudo usermod -a -F video <username>
4. Enter the command fswebcam followed by a filename. A picture will be taken using the webcam, and saved to the filename specified:
fswebcam image.jpg
5. Specify the resolution using the -r flag:
fswebcam -f 1280x720 image.jpg
For more information, go to...
Recording Videos
1. Install the ffmpeg packages:
sudo apt update
sudo apt install ffmpeg
2. Execute the next command to record a video from an input file, and save it to an output file:
ffmpeg -i <input file> <output file
Check out the ffmpeg documentation for more details
Most Useful Raspberry Pi Commands
Introduction
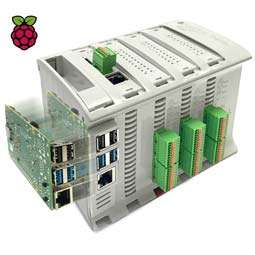
Raspberry Pi commands allow us to work on a widerange of applications. From building a prototype to developing an existing software, Raspberry Pi can provide the support.
In this section, you will learn 5 really useful command-line tools to use your Raspberry Pi or Raspberry PLCin a safe environment.
Explanation
Vcgencmd measure_temp
Vcgencmd is a command-line utility that can get various pieces of information from the VideoCore GPU on the Raspberry Pi.

It is important to know the Raspberry temperature, because excessive heat can lead you to unwanted situations. In fact, those who overclocked the processor of the Raspberry must check the temperature frequently, because all the Raspberry pi models perform a degree of thermal management to avoid overheating under heavy load. The SoCs have an internal temperature sensor, which software on the GPUpollsto ensure thattemperatures do not exceed a predefined limit.
When the core temperature is between 80ºC and 85ºC, a warning icon showing a red half-filled thermometerwill be displayed, and theARMcoreswill be progressively throttled back.
So, use measure_temp option, to get the temperature of the SoC (System on Chip) as measured by the on-board temperature sensor,to help youwith the temperature control of your device.
Check out the next URL to know more about vcgencmd
Htop
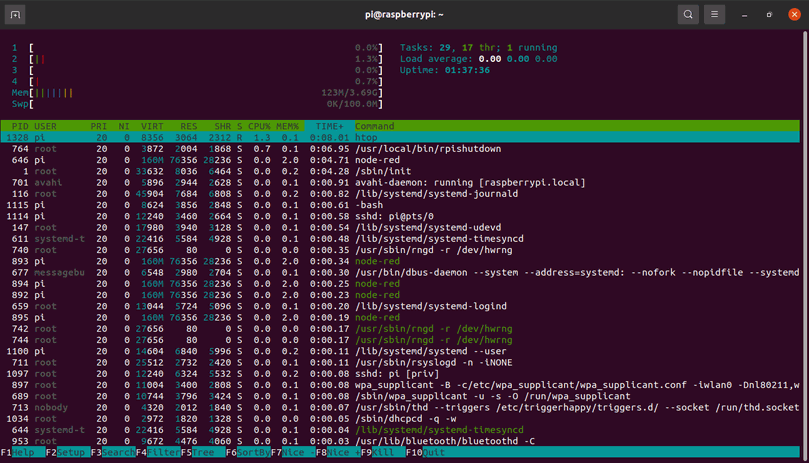
Htop is a really powerful command-line utility that allows you to interactively monitor your system's vitalresources orserver processesin real-time. It is quite similar to the top command. However,since htop is a newer program compared to top, it offers many improvements.
Htop also supports mouse operations, uses colors in its outputs and gives visual indications about processor, memory and swap usage. It also prints full command lines for processes and allows one to scroll both vertically and horizontally for processes and command-linesrespectively.
You can install it by doing:
sudo apt update
sudo apt install htop
So, if you run htop in the command line, you will get something like this:
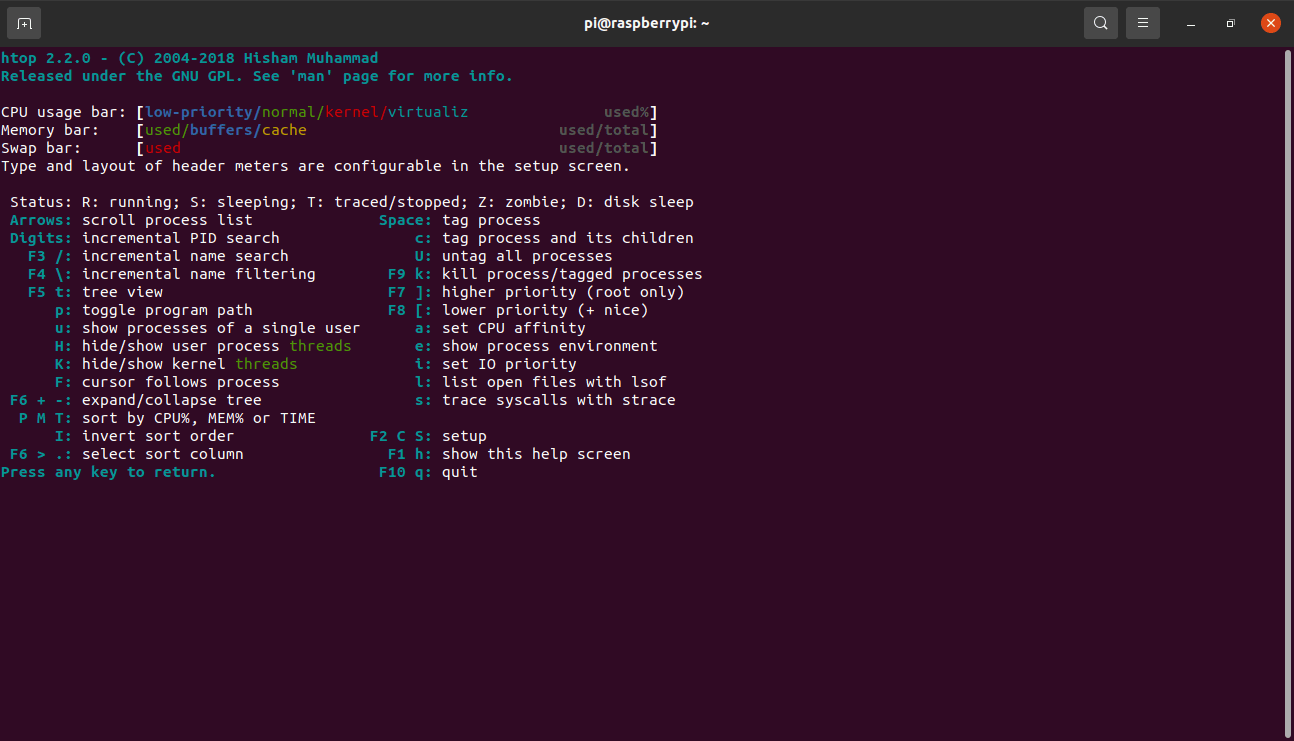
Finally, if you click on F1, you will get some help about the possibilities and you will see how it works.
Dmesg
The Linux kernel is the core of the operating system that controls access to the system resources, such as CPU, I/O devices, physical memory, and file systems. The kernel writes several messages to the kernel ring buffer during the boot process and when the system is running.
The kernel ring buffer is a portion of the physical memory that holds the kernel's log messages. It has a fixed size,which means that once the bufferis full,the older logs records are overwritten.
Dmseg is used to examine or control the kernel ring buffer. It is really useful for examining kernel boot messages and debugging hardware-related issues. The default action is to display all messages from the kernel ring buffer.
So, just execute it like:
dmesg
Usage
dmesg [options]
If you see that the dmesg command shows too many messages that you are not able to read, then find the words you really want to find using | grep:
dmesg | grep eth0

To know more about this command and its options, just type:
dmesg -h
or
man dmesg
Comma and braces operators
We can do a lot with comma and braces operations. To make our life easier, let's see a few usages:
Rename and backup operations with comma & braces operators.
Pattern matching with comma & braces operator.
Rename and backup (prefixing name) operations on long file names.
To copy files from a parent directory without typing two times the long path.
1. To backup hello.txt to hello.txt.bak:
cp hello.txt{,.bak,}
2. To revert the file from hello.txt.bak to hello.txt:
mv hello.txt{.bak,}
3. To rename the file with prefix "1-":
cp hello.txt 1-!#^
cp firstDir/secondDir/thirdDir/{hello.txt,bye.txt}

Ctrl + R
Can you imagine that you could autocomplete your commands with the ones that you typed before? Something like Google Autocomplete. Would be really useful, right? That is possible opening up terminal windows and just trying the following:
1. Ctrl + R

2. Start typing your command and some suggestion will appear:

3. If you want to type the suggested command, then click on the Tab, or the right arrow of your keyboard, and that suggested command will be set on your command line ready to use. In case you want to see more suggested commands, then try Ctrl + R again until you see the command you want to execute.

Finally, some tricky commands
1. Type "rev" to reverse the message to type:
rev

2. Type "factor <number>" to factor any number:

3. Finally, just type the following, and see what happens:
apt moo
apt-get --help | grep -i cow

Node-RED & Raspberry Pi tutorial: How to capture data from the sensor
Industrial Raspberry PLC and Node-RED applications: capturing values from the weight sensor
Introduction
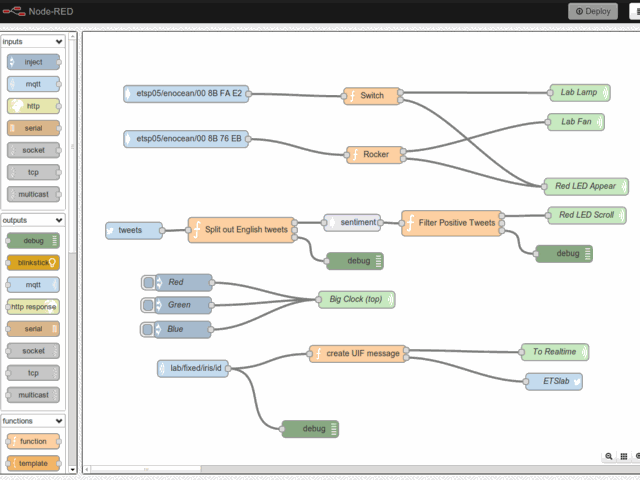
Node-RED is a programming tool for wiring together hardware devices. APIs and online services in new and interesting ways.
It provides a browser-based editor that makes it easy to wire together flows using the wide range of nodes in the palette that can be deployed to its runtime in a single click.
In this section, you will learn how to develop the Node-RED application that was shown in this link.
Explanation
Node-RED basics
As we said in the introduction, Node-RED provides a browser-based editor that makes it easy to wire together flows using the wide range of nodes in the palette that can be deployed to its runtime in a single click.
So, let's go to discover the basics:
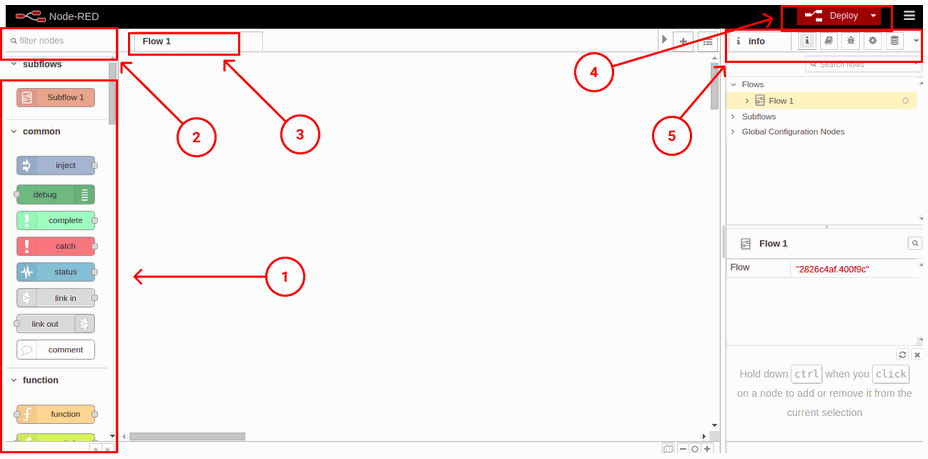
1. Node-RED has a wide range of nodes that offers you a lot of possibilities. If you go to the nodes menu on the left, you will find the nodes that come by default. They are easy to use; you just have to drag and drop them in yourflowso that you can start using them.
2. Moreover, if you already know what node you want, there is a search bar to filter nodes and find exactly the one you want.
3. If you double-click on the Flow 1 tab, a configuration window will be displayed, where you can change its name, or disable it, for example. In the same bar, there is a + tab that adds another Flow tab, so that you can use as many as you want.
4. Once you have your nodes connected and you want to Deploy your changes, click on the Deploy button. Next to the Deploy button, there is a menu that allows you to import or export your flows, or if you go to Manage palette > Install, and you type the nodes you want to install, you will be able to download as many nodes as you want, like the node-red-dashboard or the node-red-contrib-ui-media, for example.
5. Finally, in the right bar where the info tab is displayed, there are more important tabs such as:
-
Information: to get general information on the flows.
-
Help tab: which gives you information about the node you clicked on.
-
Debug messages: this is a really useful tab to know the errors you got, or to display the debug node messages.
-
Configuration nodes: It shows the configuration nodes from the flows.
-
Dashboard: This tab allows you to set the dashboard layout, site configuration and theme.
Our nodes
So, now you know the basics, let's introduce the nodes we are going to use:
-
Ui_button node: Adds a button to the user interface. Clicking the button generates a message with msg.payload set to the Payload field. If no payload is specified, the node id is used.
-
Function node: A JavaScript function to run against the messages being received by the node. The messages are passed in as a JavaScript object called msg. By convention, it will have a msg.payload property containing the body of the message.
-
Exec node: Runs a system command and returns its output. The node can be configured to either wait until the command completes, or to send its output as the command generates it. The command that is run can be configured in the node or provided by the received message.
-
Change node: Set, change, delete or move properties of a message, flow context or global context. The node can specify multiple rules that will be applied in the order they are defined.
-
Switch node: Route messages based on their property values or sequence position.
-
Ui_chart node: Plots the input values on a chart. This can either be a time-based line chart, a bar chart (vertical or horizontal), or a pie chart.
-
Ui_gauge node: Adds a gauge type widget to the user interface. The msg.payload is searched for a numeric value and is formatted in accordance with the defined Value Format.
-
Ui_medianode: Displays media files and URLs on the Dashboard.
-
Status node: Report status messages from other nodes on the same tab.
Getting the weight value
What we are going to do is to start getting the values from a weight sensor, and when the application finds the valuewe set, the USB camera will take a picture. So, let's start developing our application!
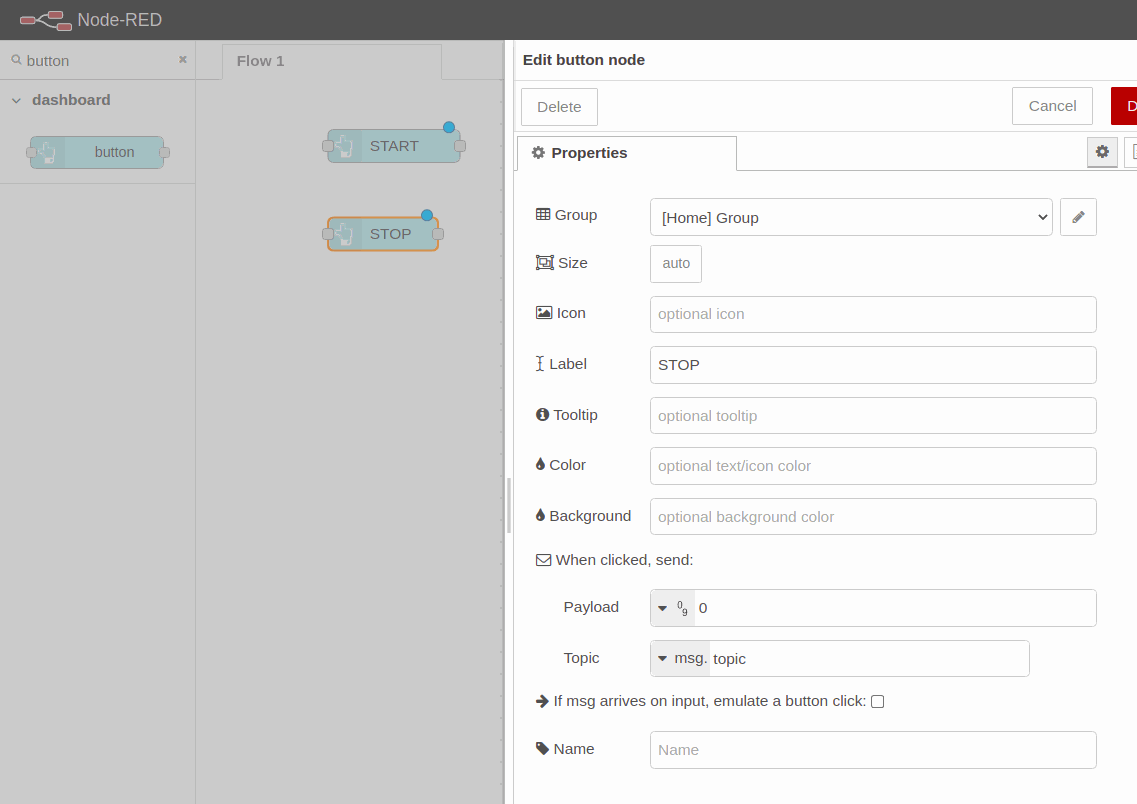
1. First of all, you are going to add two dashboard buttons: the first one to start the application, and the other one to stop it. So, go to the filter nodes search bar and type: button. Add two buttons to the flow, and double-click to edit them.
In the first one, you must create a UI Group and a UI Tab to display our dashboard. Once done, it will work for all the Dashboard nodes, so it is only necessary once. After that, you will type a label to be displayed, in our case: START.
Likewise, the STOP button will have the same configuration; you will select the group and tab where you want to display it, you will type: STOP as a label and we will add a 0 to the payload, so that the value for the gauge sets to 0 when the application stops, instead of stopping in the last value.
2. You are going to add a function node next to the start button and wire it.
In the start node, you are going to initialize a flow variable named count to 0, which you are going to use later on when you name the pictures, and you are going to send the message with the command to execute for the app to start.
var count = flow.get('count')||0;
flow.set('count', count);
var newMsg = {payload: "python -u /home/pi/hx711py/example.py"};
return newMsg;
You can give a name to the function node as you would like to see it in your flow. In this case: start flow.count and send python cmd. Finally, wire an Exec node and edit it. Select the output: "while the command is running -spawn mode", and click on the checkbox to append the msg.payload.
3. When there is an exec node running as spawn mode, that generates a PID of the running process, that you will have to get to be able to kill it. So that is what you are going to do right now.
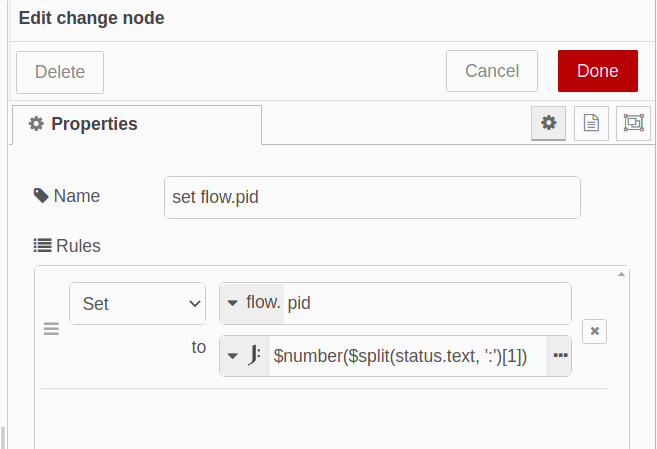
Add a status node, go to "Report status from" and select "Selected nodes". Choose the exec node, and click on Done. After that, wire a Change node, and edit it to set the flow.pid as shown on the right:
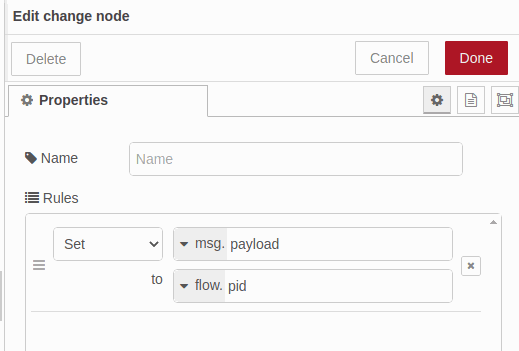
Finally, add another Change node next to the stop button and connect them. As we set the flow.pid in the previous change node, now we are going to set the msg.payload to flow.pid. By doing this, when you click on the Stop button, the msg.payload will be sent through the node.
So, now the pid is the msg.payload. Add an exec node as an exec mode to kill the pid, and edit it:
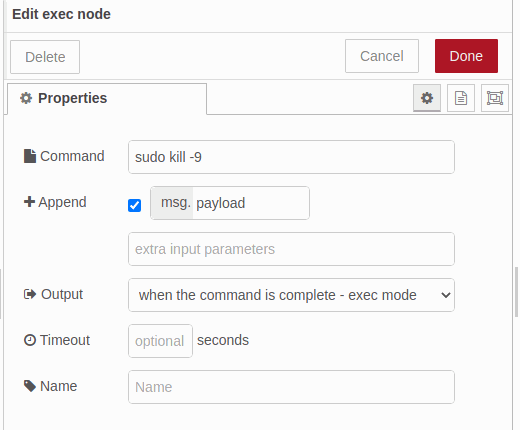
At the moment, your flow will look like:
[{"id":"2826c4af.400f9c","type":"tab","label":"Flow 1","disabled":false,"info":""},{"id":"bce0df4f.bc788","type":"ui_button","z":"2826c4af.400f9c","name":"","group":"c4c1bcc1.49c24","order":16,"width":"7","height":"2","passthru":false,"label":"START ","tooltip":"","color":"","bgcolor":"","icon":"","payload":"","payloadType":"str","topic":"topic","topicType":"msg","x":140,"y":140,"wires":[["882b392c.ab71b8"]]},{"id":"222e70bc.56f6","type":"ui_button","z":"2826c4af.400f9c","name":"","group":"c4c1bcc1.49c24","order":15,"width":0,"height":0,"passthru":false,"label":"STOP","tooltip":"","color":"","bgcolor":"","icon":"","payload":"0","payloadType":"num","topic":"topic","topicType":"msg","x":130,"y":220,"wires":[["63e42d5b.dee384"]]},{"id":"882b392c.ab71b8","type":"function","z":"2826c4af.400f9c","name":"start flow.count and send python cmd","func":"var count = flow.get('count')||0;\nflow.set('count', count);\n\nvar newMsg = {payload: \"python -u /home/pi/hx711py/example.py\"};\nreturn newMsg;","outputs":1,"noerr":0,"initialize":"","finalize":"","libs":[],"x":410,"y":140,"wires":[["9628a2eb.2a5d3"]]},{"id":"2abcf1ce.f1931e","type":"status","z":"2826c4af.400f9c","name":"","scope":["9628a2eb.2a5d3"],"x":140,"y":60,"wires":[["b7fab428.f4fb78"]]},{"id":"9628a2eb.2a5d3","type":"exec","z":"2826c4af.400f9c","command":"","addpay":"payload","append":"","useSpawn":"true","timer":"","oldrc":false,"name":"","x":690,"y":140,"wires":[[],[],[]]},{"id":"b7fab428.f4fb78","type":"change","z":"2826c4af.400f9c","name":"","rules":[{"t":"set","p":"pid","pt":"flow","to":"$number($split(status.text, ':')[1])","tot":"jsonata"}],"action":"","property":"","from":"","to":"","reg":false,"x":410,"y":60,"wires":[[]]},{"id":"63e42d5b.dee384","type":"change","z":"2826c4af.400f9c","name":"","rules":[{"t":"set","p":"payload","pt":"msg","to":"pid","tot":"flow"}],"action":"","property":"","from":"","to":"","reg":false,"x":420,"y":220,"wires":[["46ba8b75.815004"]]},{"id":"46ba8b75.815004","type":"exec","z":"2826c4af.400f9c","command":"sudo kill -9","addpay":"payload","append":"","useSpawn":"false","timer":"","oldrc":false,"name":"","x":690,"y":220,"wires":[[],[],[]]},{"id":"c4c1bcc1.49c24","type":"ui_group","name":"Group","tab":"cbda5f28.c75ad","order":1,"disp":true,"width":"20","collapse":false},{"id":"cbda5f28.c75ad","type":"ui_tab","name":"Home","icon":"dashboard","disabled":false,"hidden":false}]
4. Now, you are going to see the values from the last 1 hour in a line chart, and also in real time in a gauge.
Then, drag and drop a chart node and a gauge node, and let's edit them.
In the chart node, set de X-axis to the last 1 hour, or the time you would like to register, add the Tab and Group you would like to display in and click on Done.
Edit the gauge node by choosing the same Tab and Group and setting a label to display as its title, also type the units. Finally, set the minimum and the maximum value to set the range:
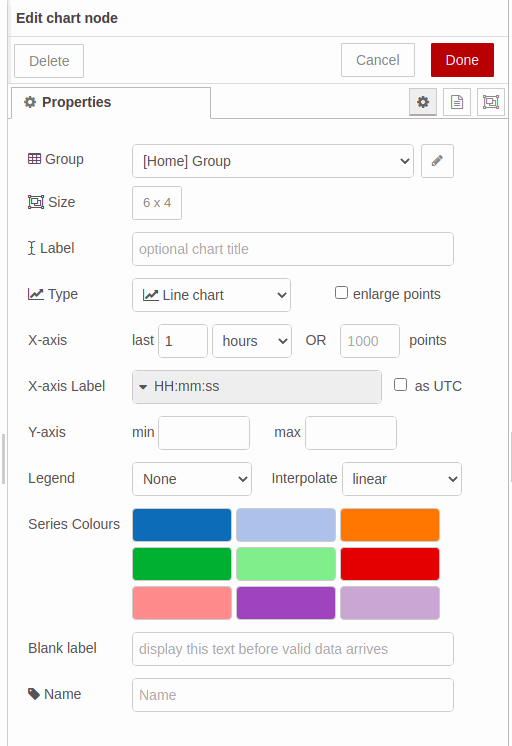
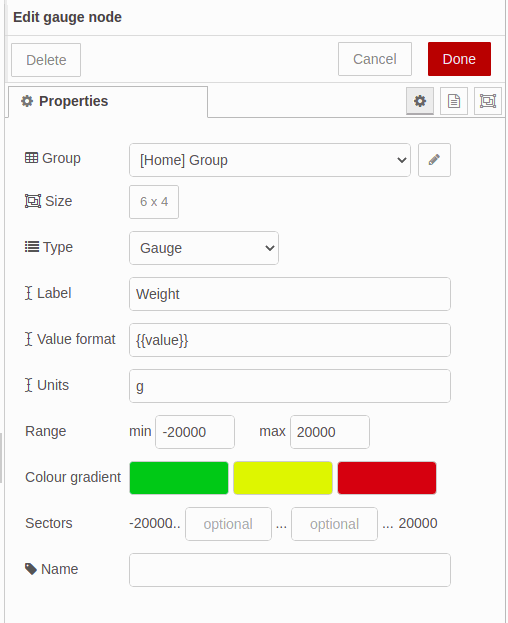
Finally, connect them as shown below:
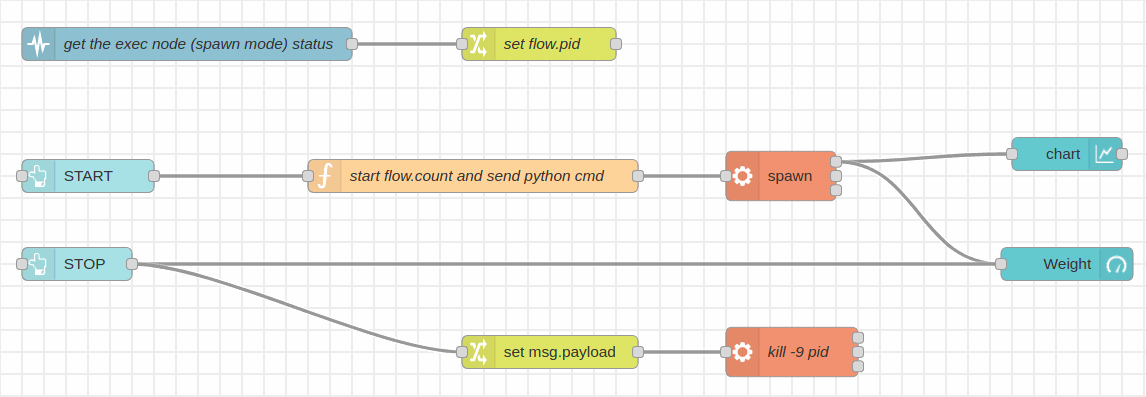
Weight! Picture this!
Once you got the values of our Raspberry scale and you displayed them to your Dashboard, it is time to take some photos.
For the following steps it is necessary to install thenode-red-contrib-ui-media,so if you did not do it yet, please go to this post to know how.
5. Now, you are going to add a switch node and set if a property is between 50 and 100 to take a picture. The values are up to you, just choose the value rules, choose the number field, and add the number you want to feature. Connect this node to the spawn node.
6. Connected to the output of the last change node, add a function node to send the fswebcam command and set the flow.count to name the pictures with a counter as follows:
var count = flow.get('count'); count++;
msg.payload = "fswebcam -r 1280x720 --no-banner /home/pi/images/image" + count + ".jpg";
flow.set('count', count); return msg;
You should add three parameters to the fswebcam command:
a. - r to set the photo resolution.
b. --no-banner to skip the camera banner
c. The path to say where to save the images, and how are they be going to be named.
7. The function node will send a msg.payload, so you are going to add an exec node appending the msg.payload to execute the command in your industrial Raspberry Pi PLC controller.
8. The exec mode has three outputs. The first one returns the stdout, the second one returns the stderr and the last one, returns the return code. So in this case, connect the third output, the return code, to a switch node to continue with the flow if there was no error.
So, in the switch node, set the property to msg.payload.code and set the value rule to equal number 0, to be sure that the fwwebcam command was executed with no errors.
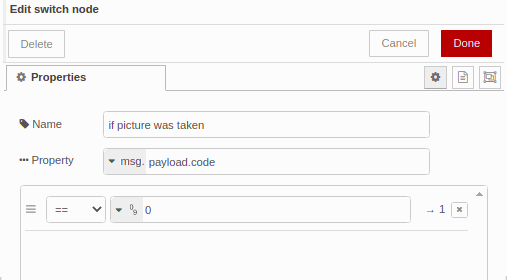
9. After that, connect a function node to send the name of the picture it was just taken, so that it can be displayed in the Node-RED Dashboard. Once edited as shown below, connect a change node to move the msg.payload to msg.src:
let count = flow.get('count');
msg.payload = "/image" + count + ".jpg";
return msg;

10. Finally, add the media node and just add a Group to it, or configure the layout as you want.
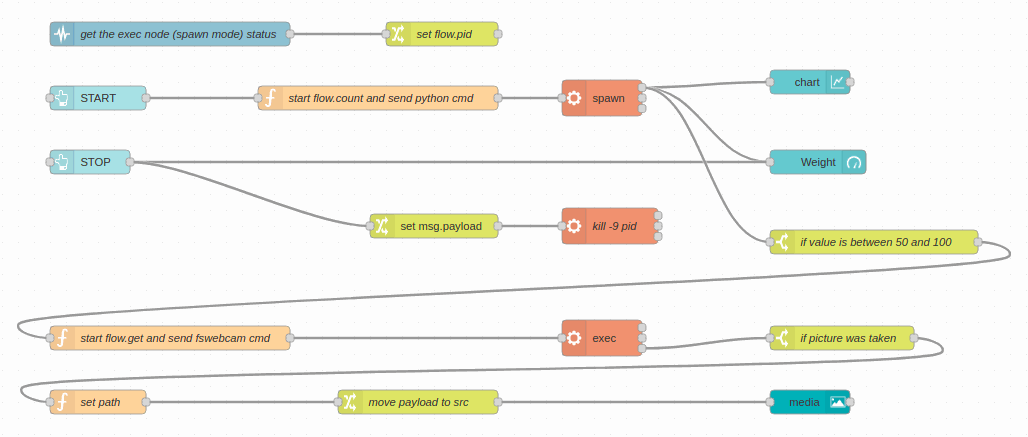
Now, your Node-RED application should look like this:
[{"id":"2826c4af.400f9c","type":"tab","label":"Flow 1","disabled":false,"info":""},{"id":"9b234a13.0256e8","type":"exec","z":"2826c4af.400f9c","command":"","addpay":"payload","append":"","useSpawn":"false","timer":"","oldrc":false,"name":"","x":510,"y":260,"wires":[[],[],["3f27e8b4.d02378"]]},{"id":"ec5481a.4fbf28","type":"exec","z":"2826c4af.400f9c","command":"","addpay":"payload","append":"","useSpawn":"true","timer":"","oldrc":false,"name":"","x":870,"y":60,"wires":[["36307784.3144e8","372e8f7b.f9752","d4e34cd5.f423e"],[],[]]},{"id":"36307784.3144e8","type":"switch","z":"2826c4af.400f9c","name":"if value is between 50 and 100","property":"payload","propertyType":"msg","rules":[{"t":"btwn","v":"50","vt":"num","v2":"100","v2t":"num"}],"checkall":"true","repair":false,"outputs":1,"x":990,"y":160,"wires":[["fb666c7f.c2ff9"]]},{"id":"3f27e8b4.d02378","type":"switch","z":"2826c4af.400f9c","name":"if picture was taken","property":"payload.code","propertyType":"msg","rules":[{"t":"eq","v":"0","vt":"num"}],"checkall":"true","repair":false,"outputs":1,"x":1030,"y":260,"wires":[["7646b60e.83a318"]]},{"id":"7646b60e.83a318","type":"function","z":"2826c4af.400f9c","name":"set path","func":"let count = flow.get('count');\nmsg.payload = \"/image\" + count + \".jpg\";\nreturn msg;","outputs":1,"noerr":0,"initialize":"","finalize":"","libs":[],"x":140,"y":360,"wires":[["a4078c82.e803a"]]},{"id":"a4078c82.e803a","type":"change","z":"2826c4af.400f9c","name":"move payload to src","rules":[{"t":"move","p":"payload","pt":"msg","to":"src","tot":"msg"}],"action":"","property":"","from":"","to":"","reg":false,"x":560,"y":360,"wires":[["3385b59c.06c81a"]]},{"id":"8771f8be.e44f68","type":"ui_button","z":"2826c4af.400f9c","name":"","group":"c4c1bcc1.49c24","order":5,"width":7,"height":2,"passthru":false,"label":"STOP LOAD CELL","tooltip":"","color":"","bgcolor":"","icon":"","payload":"0","payloadType":"num","topic":"","topicType":"str","x":170,"y":160,"wires":[["e053ecae.bca31","d4e34cd5.f423e"]]},{"id":"d4e34cd5.f423e","type":"ui_gauge","z":"2826c4af.400f9c","name":"","group":"c4c1bcc1.49c24","order":13,"width":6,"height":4,"gtype":"gage","title":"Weight","label":"g","format":"{{value}}","min":"-2000","max":"2000","colors":["#00b500","#e6e600","#ca3838"],"seg1":"","seg2":"","x":1070,"y":100,"wires":[]},{"id":"372e8f7b.f9752","type":"ui_chart","z":"2826c4af.400f9c","name":"","group":"c4c1bcc1.49c24","order":11,"width":6,"height":4,"label":"","chartType":"line","legend":"false","xformat":"HH:mm:ss","interpolate":"linear","nodata":"","dot":false,"ymin":"","ymax":"","removeOlder":1,"removeOlderPoints":"","removeOlderUnit":"3600","cutout":0,"useOneColor":false,"useUTC":false,"colors":["#1f77b4","#aec7e8","#ff7f0e","#2ca02c","#98df8a","#d62728","#ff9896","#9467bd","#c5b0d5"],"outputs":1,"useDifferentColor":false,"x":1070,"y":60,"wires":[[]]},{"id":"99be7e29.78696","type":"ui_button","z":"2826c4af.400f9c","name":"","group":"c4c1bcc1.49c24","order":3,"width":7,"height":2,"passthru":false,"label":"START LOAD CELL","tooltip":"","color":"","bgcolor":"","icon":"","payload":"","payloadType":"str","topic":"","topicType":"str","x":180,"y":60,"wires":[["615b1ef6.53963"]]},{"id":"615b1ef6.53963","type":"function","z":"2826c4af.400f9c","name":"start flow.count and send python cmd","func":"var count = flow.get('count')||0;\nflow.set('count', count);\n\nvar newMsg = {payload: \"sudo python -u /home/pi/hx711py/example.py\"};\nreturn newMsg;","outputs":1,"noerr":0,"initialize":"","finalize":"","libs":[],"x":610,"y":60,"wires":[["ec5481a.4fbf28"]]},{"id":"3385b59c.06c81a","type":"ui_media","z":"2826c4af.400f9c","group":"c4c1bcc1.49c24","name":"","width":6,"height":4,"order":15,"category":"","file":"","layout":"expand","showcontrols":true,"loop":true,"onstart":false,"scope":"local","tooltip":"","x":1070,"y":360,"wires":[[]]},{"id":"16de31a2.e4a6de","type":"status","z":"2826c4af.400f9c","name":"get the exec node status","scope":["ec5481a.4fbf28"],"x":190,"y":600,"wires":[["9bb820b3.87fbe"]]},{"id":"9bb820b3.87fbe","type":"change","z":"2826c4af.400f9c","name":"set flow.pid","rules":[{"t":"set","p":"pid","pt":"flow","to":"$number($split(status.text, ':')[1])","tot":"jsonata"}],"action":"","property":"","from":"","to":"","reg":false,"x":410,"y":600,"wires":[["b99c988c.86bf98"]]},{"id":"b99c988c.86bf98","type":"function","z":"2826c4af.400f9c","name":"set kill cmd","func":"let pid = flow.get('pid');\nvar kill = \"kill -9 \" + pid;\nflow.set('kill', kill);\nreturn msg;","outputs":1,"noerr":0,"initialize":"","finalize":"","libs":[],"x":590,"y":600,"wires":[[]]},{"id":"e053ecae.bca31","type":"function","z":"2826c4af.400f9c","name":"killall python","func":"msg.payload = \"sudo killall python\";\nreturn msg;","outputs":1,"noerr":0,"initialize":"","finalize":"","libs":[],"x":530,"y":160,"wires":[["ec5481a.4fbf28"]]},{"id":"fb666c7f.c2ff9","type":"function","z":"2826c4af.400f9c","name":"start flow.get and send fswebcam cmd","func":"var count = flow.get('count');\ncount++;\n\nmsg.payload = \"fswebcam -r 1280x720 --no-banner /home/pi/images/image\" + count + \".jpg\";\n\nflow.set('count', count);\n\nreturn msg;\n\n","outputs":1,"noerr":0,"initialize":"","finalize":"","libs":[],"x":230,"y":260,"wires":[["9b234a13.0256e8"]]},{"id":"5771d86a.220b58","type":"comment","z":"2826c4af.400f9c","name":"In case you want to kill the flow pid and not the python processes, replace the \"killall python\" function node, for the \"killall pid\" function node -->","info":"","x":550,"y":540,"wires":[]},{"id":"b88b67eb.03f068","type":"function","z":"2826c4af.400f9c","name":"killall pid","func":"msg.payload = flow.get('kill');\nreturn msg;","outputs":1,"noerr":0,"initialize":"","finalize":"","libs":[],"x":1100,"y":540,"wires":[[]]},{"id":"c4c1bcc1.49c24","type":"ui_group","name":"","tab":"cbda5f28.c75ad","order":1,"disp":true,"width":"20","collapse":false},{"id":"cbda5f28.c75ad","type":"ui_tab","name":"Home","icon":"dashboard","disabled":false,"hidden":false}]
Tips
If you go to the right menu, in the Dashboard tab, and you hover on your tab, you will see appear three buttons: group, edit and layout. So, if you click on layout, you will see the Dashboard layout editor, where it is possible to display your ui nodes as you want.
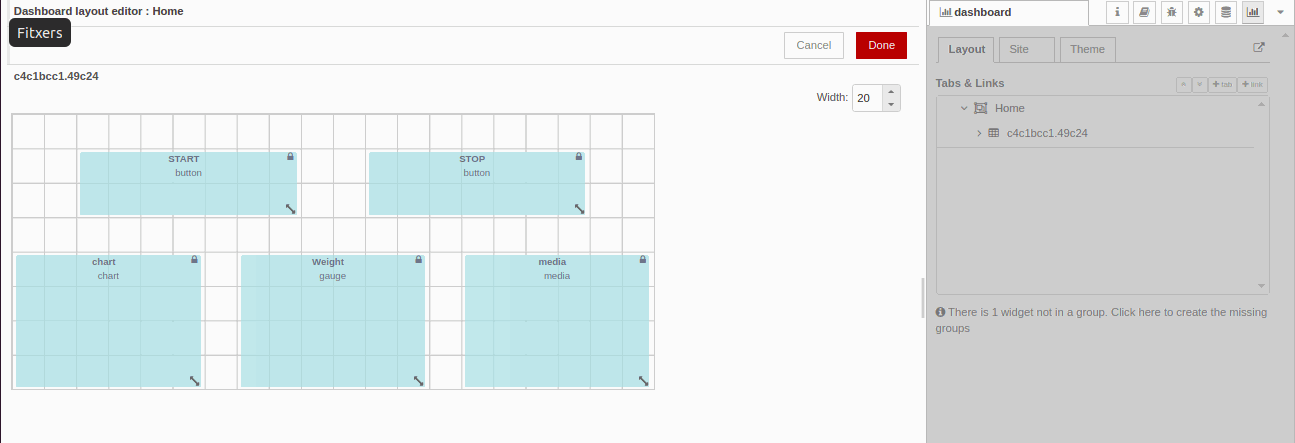
If you see that you cannot resize the widgets, go to every Dashboard node, and in the Size section, you will see that is set as auto, so just set any manual size, go back to the Dashboard layout editor, where the changes will be applied.
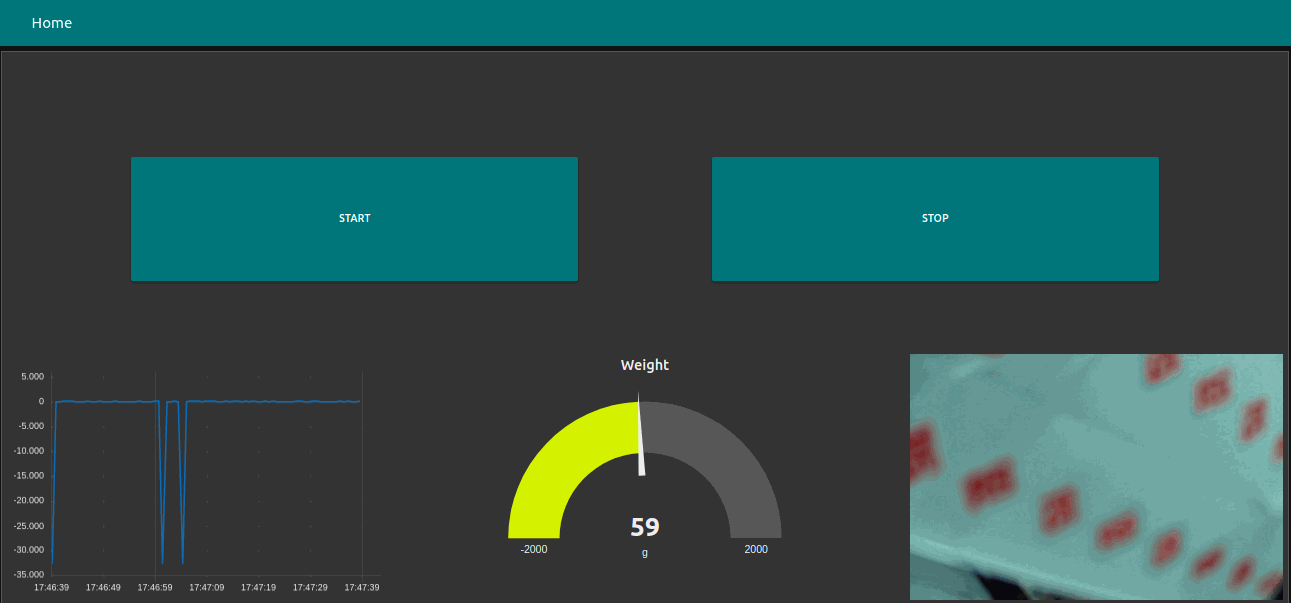
Finally, go to http://10.10.10.20:1880/ui/ to check out your Node-RED dashboard!
Taking a picture when a load cell value is detected
Introduction
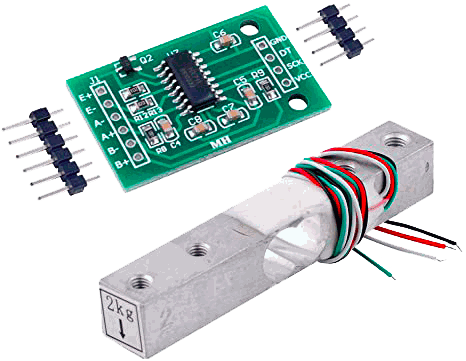
Wearable sensors are an emerging market that is rapidly gaining recognition in the global market, especially in the industrial sector.
Raspberry Pi based PLC family offers a wide range of possibilities to control and monitor this innovative technology.
In this section, you will learn how to take a picture using a USB camera when a load cell detects a specific value, controlled by an industrial Raspberry Pi PLC and monitoring it using Node-RED.
Requirements
-
1x Weight Sensor
-
1x HX711 Load Cell Transmitter Module
-
4x cables
-
1x USB camera
Explanation
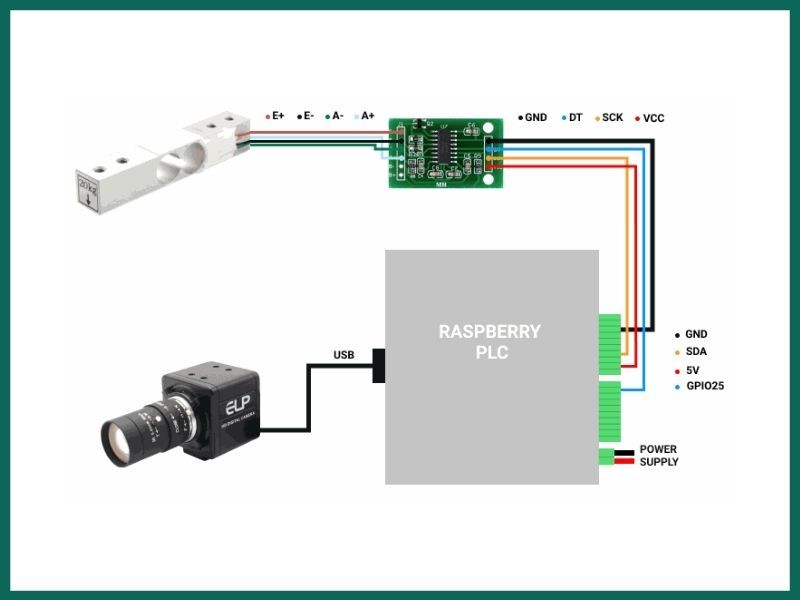
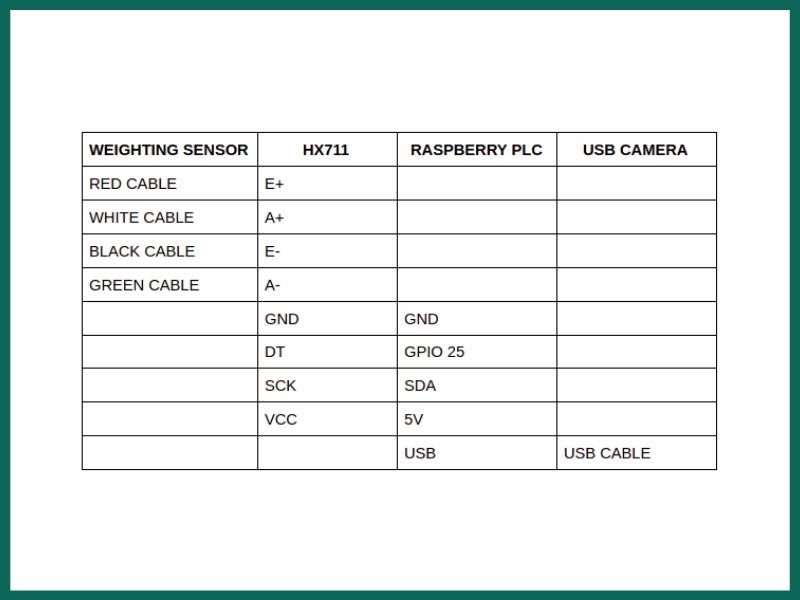
Connecting hardware
Connect the hardware as shown below to proceed with the software:
Weight sensor setup
1. First, let's clone a project that contains an example file which shows a function of the library. So, open up a terminal window in your Raspberry Pi PLC controller and type the following:
git clone https://github.com/tatobari/hx711py
2. Once the repository was cloned, a directory named hx711py will appear with the file named example.py. So, go to that file to adjust some changes:
cd hx711py
sudo nano example.py
3. Inside the file, let's modify some lines, so that the code looks as follows:
#! /usr/bin/python2
import time
import sys
EMULATE_HX711=False
referenceUnit = -1
if not EMULATE_HX711:
import RPi.GPIO as GPIO
from hx711 import HX711
else:
from emulated_hx711 import HX711
def cleanAndExit():
print("Cleaning...")
if not EMULATE_HX711:
GPIO.cleanup()
print("Bye!")
sys.exit()
hx = HX711(25, 2)
hx.set_reference_unit(referenceUnit)
hx.reset()
hx.tare()
print("Tare done! Add weight now...")
def func():
while True:
try:
val = hx.get_weight(5)
yield val
hx.power_down()
hx.power_up()
time.sleep(0.1)
except (KeyboardInterrupt, SystemExit):
cleanAndExit()
function = func()
for i in function:
print(i)
4. Once the code was modified, exit with Ctrl + X, type 'Y' to save the file with the same name and Enter.
Test the Raspberry scale
1. For a correct calibration and to be able to get the right weight, you need a comparison object whose weight you know. It is recommended to choose an average value of the maximum the load cell can get. For example, if your weight scale can get up to 20 kgs, then it is recommended to choose an object its weight is 10 kgs.
2. First of all, you need to comment the next line as follows:
#hx.set_reference_unit(referenceUnit)
3. And then, place the object on the scale and run it with the following command:
sudo python example.py
4. You will see that the displayed values will be both positive and negative. In this case, they are displayed at 24500 values around -22200. So we referenced the values like:
−22200 ÷ 24500 = -0.9
5. After getting that value, go back to the line we commented earlier, and uncommented it removing the hashtag, and typing the value you got as a reference unit like:
hx.set_reference_unit(referenceUnit)
referenceUnit = -1
If you have achieved a successful calibration, you will see that the value of the weight scale will be around 0. Otherwise, you can modify the referenceUnit variable to get the right calibration.
Getting the values with Node-RED
1. By default, our Raspberry PLC images have Node-RED already installed. If you do not have the Node-RED installed in your device, first go to this URL to proceed with the installation.
2. Once Node-RED is ready, from your computer go to your browser and type: http://10.10.10.20:1880/ if you are connected through Ethernet, or http://wlan0-pi-address:1880/ if you want to connected through the WiFi.
3. After opening up a new Node-RED window, go to the right menu, click on Manage palette > Install > Type: node-red-contrib-ui-media and install it.
4. After that, click on Import, and paste the following flows.json and click on the Deploy button:
[{"id":"2826c4af.400f9c","type":"tab","label":"Flow 1","disabled":false,"info":""},{"id":"9b234a13.0256e8","type":"exec","z":"2826c4af.400f9c","command":"","addpay":"payload","append":"","useSpawn":"false","timer":"","oldrc":false,"name":"","x":510,"y":260,"wires":[[],[],["3f27e8b4.d02378"]]},{"id":"ec5481a.4fbf28","type":"exec","z":"2826c4af.400f9c","command":"","addpay":"payload","append":"","useSpawn":"true","timer":"","oldrc":false,"name":"","x":870,"y":60,"wires":[["36307784.3144e8","372e8f7b.f9752","d4e34cd5.f423e"],[],[]]},{"id":"36307784.3144e8","type":"switch","z":"2826c4af.400f9c","name":"if value is between 50 and 100","property":"payload","propertyType":"msg","rules":[{"t":"btwn","v":"50","vt":"num","v2":"100","v2t":"num"}],"checkall":"true","repair":false,"outputs":1,"x":990,"y":160,"wires":[["fb666c7f.c2ff9"]]},{"id":"3f27e8b4.d02378","type":"switch","z":"2826c4af.400f9c","name":"if picture was taken","property":"payload.code","propertyType":"msg","rules":[{"t":"eq","v":"0","vt":"num"}],"checkall":"true","repair":false,"outputs":1,"x":1030,"y":260,"wires":[["7646b60e.83a318"]]},{"id":"7646b60e.83a318","type":"function","z":"2826c4af.400f9c","name":"set path","func":"let count = flow.get('count');\nmsg.payload = \"/image\" + count + \".jpg\";\nreturn msg;","outputs":1,"noerr":0,"initialize":"","finalize":"","libs":[],"x":140,"y":360,"wires":[["a4078c82.e803a"]]},{"id":"a4078c82.e803a","type":"change","z":"2826c4af.400f9c","name":"move payload to src","rules":[{"t":"move","p":"payload","pt":"msg","to":"src","tot":"msg"}],"action":"","property":"","from":"","to":"","reg":false,"x":560,"y":360,"wires":[["3385b59c.06c81a"]]},{"id":"8771f8be.e44f68","type":"ui_button","z":"2826c4af.400f9c","name":"","group":"c4c1bcc1.49c24","order":5,"width":7,"height":2,"passthru":false,"label":"STOP LOAD CELL","tooltip":"","color":"","bgcolor":"","icon":"","payload":"0","payloadType":"num","topic":"","topicType":"str","x":170,"y":160,"wires":[["e053ecae.bca31","d4e34cd5.f423e"]]},{"id":"d4e34cd5.f423e","type":"ui_gauge","z":"2826c4af.400f9c","name":"","group":"c4c1bcc1.49c24","order":13,"width":6,"height":4,"gtype":"gage","title":"Weight","label":"g","format":"{{value}}","min":"-2000","max":"2000","colors":["#00b500","#e6e600","#ca3838"],"seg1":"","seg2":"","x":1070,"y":100,"wires":[]},{"id":"372e8f7b.f9752","type":"ui_chart","z":"2826c4af.400f9c","name":"","group":"c4c1bcc1.49c24","order":11,"width":6,"height":4,"label":"","chartType":"line","legend":"false","xformat":"HH:mm:ss","interpolate":"linear","nodata":"","dot":false,"ymin":"","ymax":"","removeOlder":1,"removeOlderPoints":"","removeOlderUnit":"3600","cutout":0,"useOneColor":false,"useUTC":false,"colors":["#1f77b4","#aec7e8","#ff7f0e","#2ca02c","#98df8a","#d62728","#ff9896","#9467bd","#c5b0d5"],"outputs":1,"useDifferentColor":false,"x":1070,"y":60,"wires":[[]]},{"id":"99be7e29.78696","type":"ui_button","z":"2826c4af.400f9c","name":"","group":"c4c1bcc1.49c24","order":3,"width":7,"height":2,"passthru":false,"label":"START LOAD CELL","tooltip":"","color":"","bgcolor":"","icon":"","payload":"","payloadType":"str","topic":"","topicType":"str","x":180,"y":60,"wires":[["615b1ef6.53963"]]},{"id":"615b1ef6.53963","type":"function","z":"2826c4af.400f9c","name":"start flow.count and send python cmd","func":"var count = flow.get('count')||0;\nflow.set('count', count);\n\nvar newMsg = {payload: \"sudo python -u /home/pi/hx711py/example.py\"};\nreturn newMsg;","outputs":1,"noerr":0,"initialize":"","finalize":"","libs":[],"x":610,"y":60,"wires":[["ec5481a.4fbf28"]]},{"id":"3385b59c.06c81a","type":"ui_media","z":"2826c4af.400f9c","group":"c4c1bcc1.49c24","name":"","width":6,"height":4,"order":15,"category":"","file":"","layout":"expand","showcontrols":true,"loop":true,"onstart":false,"scope":"local","tooltip":"","x":1070,"y":360,"wires":[[]]},{"id":"16de31a2.e4a6de","type":"status","z":"2826c4af.400f9c","name":"get the exec node status","scope":["ec5481a.4fbf28"],"x":190,"y":600,"wires":[["9bb820b3.87fbe"]]},{"id":"9bb820b3.87fbe","type":"change","z":"2826c4af.400f9c","name":"set flow.pid","rules":[{"t":"set","p":"pid","pt":"flow","to":"$number($split(status.text, ':')[1])","tot":"jsonata"}],"action":"","property":"","from":"","to":"","reg":false,"x":410,"y":600,"wires":[["b99c988c.86bf98"]]},{"id":"b99c988c.86bf98","type":"function","z":"2826c4af.400f9c","name":"set kill cmd","func":"let pid = flow.get('pid');\nvar kill = \"kill -9 \" + pid;\nflow.set('kill', kill);\nreturn msg;","outputs":1,"noerr":0,"initialize":"","finalize":"","libs":[],"x":590,"y":600,"wires":[[]]},{"id":"e053ecae.bca31","type":"function","z":"2826c4af.400f9c","name":"killall python","func":"msg.payload = \"sudo killall python\";\nreturn msg;","outputs":1,"noerr":0,"initialize":"","finalize":"","libs":[],"x":530,"y":160,"wires":[["ec5481a.4fbf28"]]},{"id":"fb666c7f.c2ff9","type":"function","z":"2826c4af.400f9c","name":"start flow.get and send fswebcam cmd","func":"var count = flow.get('count');\ncount++;\n\nmsg.payload = \"fswebcam -r 1280x720 --no-banner /home/pi/images/image\" + count + \".jpg\";\n\nflow.set('count', count);\n\nreturn msg;\n\n","outputs":1,"noerr":0,"initialize":"","finalize":"","libs":[],"x":230,"y":260,"wires":[["9b234a13.0256e8"]]},{"id":"5771d86a.220b58","type":"comment","z":"2826c4af.400f9c","name":"In case you want to kill the flow pid and not the python processes, replace the \"killall python\" function node, for the \"killall pid\" function node -->","info":"","x":550,"y":540,"wires":[]},{"id":"b88b67eb.03f068","type":"function","z":"2826c4af.400f9c","name":"killall pid","func":"msg.payload = flow.get('kill');\nreturn msg;","outputs":1,"noerr":0,"initialize":"","finalize":"","libs":[],"x":1100,"y":540,"wires":[[]]},{"id":"c4c1bcc1.49c24","type":"ui_group","name":"","tab":"cbda5f28.c75ad","order":1,"disp":true,"width":"20","collapse":false},{"id":"cbda5f28.c75ad","type":"ui_tab","name":"Home","icon":"dashboard","disabled":false,"hidden":false}]
5. Go to your Raspberry terminal again, and type:
cd
mkdir images
sudo nano /home/pi/.node-red/settings.js
-
cd: It leads to the /home/pi directory.
-
mkdir images: This command makes a new directory called 'images' in the current directory. This directory will store all the images taken by the camera.
Finally, we are going to modify a line to be able to get the images from a source.
6. FInd the line with the httpStatic parameter and do the following:
//httpStatic: '/home/nol/node-red-static/', ------------> Replace this
httpStatic: '/home/pi/images', ------------> For this
7. Reboot your open source PLC Raspberry Pi.
8. After rebooting, go again to your browser and type http://10.10.10.20:1880/ui.
9. If everything went right, you can to test and enjoy you application!
Connect industrial Raspberry PLC to Wi-Fi
Introduction
Raspberry Pi based PLC family devices has Wi-Fi wireless connectivity by default.
It uses the two most common frequencies: 2.4GHz and 5GHz. It also uses the IEEE 802.11.b/g/n/ac bands. And, to connect them to the Wi-Fi network, you have to follow some specific steps.
Requirements
The key points to consider are as follows:
Industrial Raspberry Pi PLC family
PLC access: shh. A tutorial on how to access the device via Linux or Windows can be found in the Raspberry Pi PLC controller User Guide.
Explanation
To connect this PLC with your Wi-Fi network, you must modify the wpa_supplicant file inside the Raspberry Pi:
sudo nano /etc/wpa_supplicant/wpa_supplicant.conf
And you must configure the file with the configuration parameters of the Wi-Fi network (it may change depending on the specific configuration of each case):
ctrl_interface=DIR=/var/run/wpa_supplicant GROUP=netdev
update_config=1
country=GB
network={
ssid="NETWORK SSID"
psk="NETWORK PASSWORD"
key_mgmt=WPA-PSK
}
And that is all, after that you must restart the networking services to apply the changes:
sudo service networking restart
Or you can reboot the system to apply the changes:
sudo reboot
