Case study · Service station · ESP32 PLC 21 CORE
Count the cars on the road. Know who stops.
Sensors in the road count every vehicle. A WiFi PLC sends the data.
The pumps record what was sold. The road sensors show who passed, who came in and how long they stayed.
Three numbers for every hour: vehicles on the road, vehicles that enter, minutes they stay.
This case describes a service station whose operator wanted real data on its vehicle traffic. The case does not name the operator or the site, and it does not publish its figures. The values in the panels are examples, not data from the installation.
The challenge
A station sells fuel, food and services. When do the customers come?
A service station today is more than a place to refuel. It has a restaurant, a car wash, a workshop or a shop. Many stations now try to adjust their prices to the behaviour of their customers. This operator wanted a real-time study of the vehicle traffic at the station and on the road in front, to base its market strategy on solid data.
How long vehicles stay
The average stay of the vehicles. It helps to forecast when queues form at the pumps and when to change the price of fuel.
Who enters and does not refuel
The rate of vehicles that enter and do not refuel, and those that stop at the bar or the shop. It shows the best time to promote the shop, the cafeteria or the station.
Traffic on the road
The volume of traffic on the road in front of the station, every hour, to compare it with the consumption of the customers.
Offers at the right moment
With behaviour by period and by date, the managers plan the offer, launch special promotions or adapt the fuel price at key moments, such as weekends or the busiest hours of holidays.
Wireless, in the existing station
The solution adapts to the place. The sensors report each vehicle by radio, and the PLC joins the local network of the station over WiFi.
How it works
Three stages: detect, compute, compare.
Each stage shows one part of the system. Press the buttons and move the sliders. The panels are illustrative simulations: lanes, rates, stays and hourly profiles are examples, not data from the installation.
Each detection point reports by radio.
Electromagnetic transducers sit in each lane of the road in front of the station, and at the entrance and the exit of the service area. Each time a transducer detects a vehicle, it sends the data by radio to one receiver: an OpenMote B module that receives from all the transducers. The receiver passes each detection to the PLC. Pass a car, let one in, or run the traffic.
- A transducer in each lane, at the entrance and at the exit
- A radio message on each detection
- One OpenMote B receiver for all the points
Messages at the receiver (example)
Illustrative simulation. Example values. Example: two lanes, one entrance, one exit, about 450 vehicles per hour on the road and 72 entries per hour. The case does not publish the number of lanes or its traffic.
Keep each detection with the right time: NTP-synced real-time clock on an ESP32 PLC. Keep the counters after a power cut: persistent counters in NVS.
Counts become stay time and stop rate.
The counts answer the questions of the operator: how many vehicles pass, how many stop, how long they stay and how many do not refuel. A typical way to compute the stay with anonymous detectors: the vehicles inside are the entries minus the exits, and the average stay is the average number inside divided by the entries per hour. The case does not say where the fuel sales come from. Move the sliders.
- Stop rate: entries over road traffic
- A typical way to do it: average stay from the vehicles inside and the entries
- Entries without fuel: entries against fuel sales of the same hour
Hourly record on the server (example)
Illustrative simulation. Example values. Example: average stay = vehicles inside on average / entries per hour (Little's law, valid for averages over the same period). Entries without fuel assume one fuel sale per vehicle. Stay limit 10 min, an example.
Publish the counters as registers: a Modbus TCP register map for a plant.
The server keeps every hour. Node-RED shows it.
The PLC joins the local network of the station over WiFi and sends the data with Modbus TCP. The data is stored on the server and monitored with Node-RED. The operator sees it by area and by time slot, and compares it with other days. Switch between the road and the station, then compare a weekday with a Sunday.
- Data stored on the server, by hour
- Views by area and by time slot
- Comparison with other days
Key moments (example)
Illustrative simulation. Example values. Example profiles: a weekday with morning and evening peaks, a Sunday with a peak around midday and in the evening. The case does not publish its hourly data.
Several points on one screen: Node-RED dashboard for multi-station monitoring. Keep a history table: CSV logging with a live table in Node-RED.
System architecture
How do you count the traffic of a service station with a PLC?
Electromagnetic transducers in each lane of the highway in front, and at the entrance and the exit of the service area, send each detection by radio. An OpenMote B receiver collects them and passes them to a WiFi PLC. The PLC joins the local network of the station over WiFi and sends the data with Modbus TCP to a server, where Node-RED stores it and shows it on a screen or a phone.
| Signal | Between | Type | Purpose |
|---|---|---|---|
| Vehicle on a road lane | BetweenTransducer in each lane → receiver | TypeRadio | PurposeTraffic on the road, every hour |
| Vehicle at the entrance | BetweenTransducer → receiver | TypeRadio | PurposeEntries, start of the stay |
| Vehicle at the exit | BetweenTransducer → receiver | TypeRadio | PurposeExits, end of the stay |
| Detections | BetweenOpenMote B receiver → PLC | TypeSerial (typical) | PurposeCounters for each point |
| Counters and times | BetweenPLC → server | TypeWiFi, Modbus TCP | PurposeStored by hour |
| Views | BetweenServer → screen or phone | TypeNode-RED | PurposeBy area, time slot and day |
| Fuel sales (option) | BetweenPump system → server | TypeNot published | PurposeEntries without fuel |
Why it works
Measure where the vehicles pass. Compare by the hour.
A sensor at each point
Each lane, the entrance and the exit has its own transducer. The road traffic and the station traffic come from the same system.
Radio from the road
The transducers send each detection by radio to one receiver. The system adapts to the place.
An open radio stack
The OpenMote B receiver runs an open source implementation of 6TiSCH, the IETF work for IPv6 over the time-slotted channel hopping mode of IEEE 802.15.4.
A standard protocol on the network
The PLC talks Modbus TCP over the WiFi of the station. Node-RED and most SCADA systems read it.
Counts by hour, compared by day
An hourly count by area turns into views by time slot and comparisons between days: the base for offers and prices at the right moment.
Open hardware, your own code
The PLC is programmed with the Arduino IDE. New points or new counters are a change in the program.
Hardware
A WiFi PLC behind the receiver. A screen for the views.
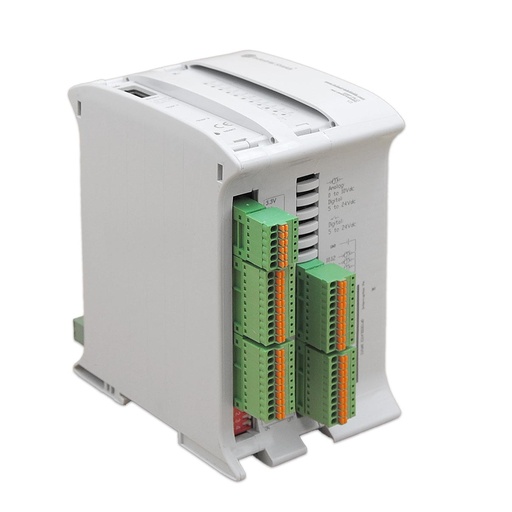
ESP32 PLC 21 CORE
An industrial controller built on the dual-core ESP32, with Wi-Fi, Bluetooth LE and Ethernet, for DIN rail. It is programmed in C++ with the Arduino IDE. Here it takes the detections from the receiver, keeps the counters with a time stamp and sends them over WiFi with Modbus TCP.
- Role
- Counters for each point, time stamps, Modbus TCP over WiFi
- Processor
- ESP32 dual core, up to 240 MHz, 16 MB flash, 520 KB SRAM
- Wireless
- Wi-Fi 2.4 GHz, Bluetooth LE
- Wired
- Ethernet 10/100 Mbit; RS-485; RS-232 and TTL serial selectable by DIP switch
- Real-time clock
- DS3231 with backup battery
- I/O
- 13 inputs, 8 outputs
- Programming
- Arduino IDE
- Mounting
- DIN rail TS35, IP20, inside a cabinet
The case used an Industrial Shields PLC of the WiFi and Bluetooth LE family, based on Arduino. The old page of the case shows an M-Duino 19R. The M-Duino PLCs with WiFi and Bluetooth are no longer in the web shop. The ESP32 PLC 21 CORE does the same job today: Wi-Fi to the station network, and a serial port for the receiver. The case does not say how the receiver connects to the PLC; check the signal levels of both sides. The OpenMote B receiver and the transducers are not Industrial Shields products.
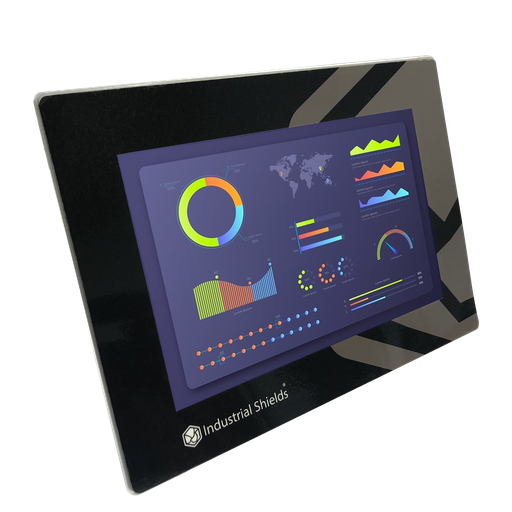
TouchBerry Pi Panel PC 10.1" FLEX
An industrial Panel PC with a Raspberry Pi 4 and a 10.1" touch screen. A typical use in this system: the screen in the station office that shows the Node-RED views by area, time slot and day.
- Role
- Screen for the Node-RED views
- Screen
- 10.1", touch
- Computer
- Raspberry Pi 4
- Network
- Gigabit Ethernet
The old page of the case lists a TouchBerry Pi 10.1" with the products of the case. The text puts the data on a server with Node-RED and does not say where the screen goes. The current model is the TouchBerry Pi Panel PC 10.1" FLEX. The family also has 7" and 18.5" models.
Questions about this case
How do you measure how long vehicles stay at a service station?
With a detector at the entrance and another at the exit. The vehicles inside are the entries minus the exits. A typical way to get the average stay with anonymous detectors: divide the average number of vehicles inside by the entries per hour (Little's law). For example, 9 vehicles inside on average and 72 entries per hour give 7.5 minutes. Use averages over the same period. Reset the inside counter when the station is empty, so a missed detection does not add up.
How do you know how many vehicles enter and do not refuel?
It is one of the goals of the case, but the case does not say where the refuelling data comes from. A typical way to do it: compare the entries of each hour with the fuel sales of the same hour from the pump system. The rest of the entries are vehicles that stop for the shop, the cafeteria or other services.
What sensors detect the vehicles in each lane?
The case uses electromagnetic transducers in each lane of the road in front of the station, and at the entrance and the exit of the service area. Sensors of this type detect the change in the magnetic field that a vehicle causes. On each detection they send a radio message to the receiver. The case does not publish the model.
What is 6TiSCH?
6TiSCH is the IETF work for IPv6 over the time-slotted channel hopping (TSCH) mode of IEEE 802.15.4. The nodes share a schedule and change channel at each slot, which suits low-power networks with radio interference. In this case, the OpenMote B receiver runs an open source implementation of it.
How does the PLC send the data to the server?
The PLC joins the local network of the station over WiFi and uses Modbus TCP. A typical way to do it: the PLC is the Modbus TCP server and keeps one register for each counter, and Node-RED on the server reads them every minute. See a Modbus TCP register map, a non-blocking WiFi reconnection and an NTP-synced clock for the time stamps.
How does the station use the data?
For its market strategy. With traffic by area, time slot and day, the managers plan the offer, launch special promotions and adapt the fuel price at key moments, such as weekends or the busiest hours of holidays. The system measures; the operator decides.
Download the case study
4-page PDF with the challenge, the logic, the architecture and the hardware. No form required.
Similar site?
Tell us where the vehicles pass. An engineer will answer.
Tell us how many lanes and accesses you want to count, how far they are from the building, and who must see the data. We will tell you which controller fits and how to connect the receiver.
- You get an answer from our technical team
- Detection points, radio link and controller sizing
- Arduino, ESP32 or Raspberry Pi based PLCs