Industrial automation: controlling temperature and humidity
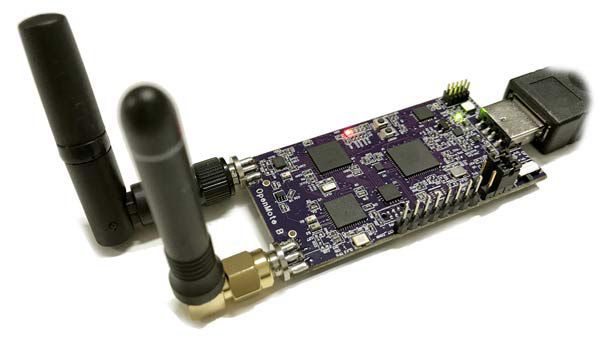
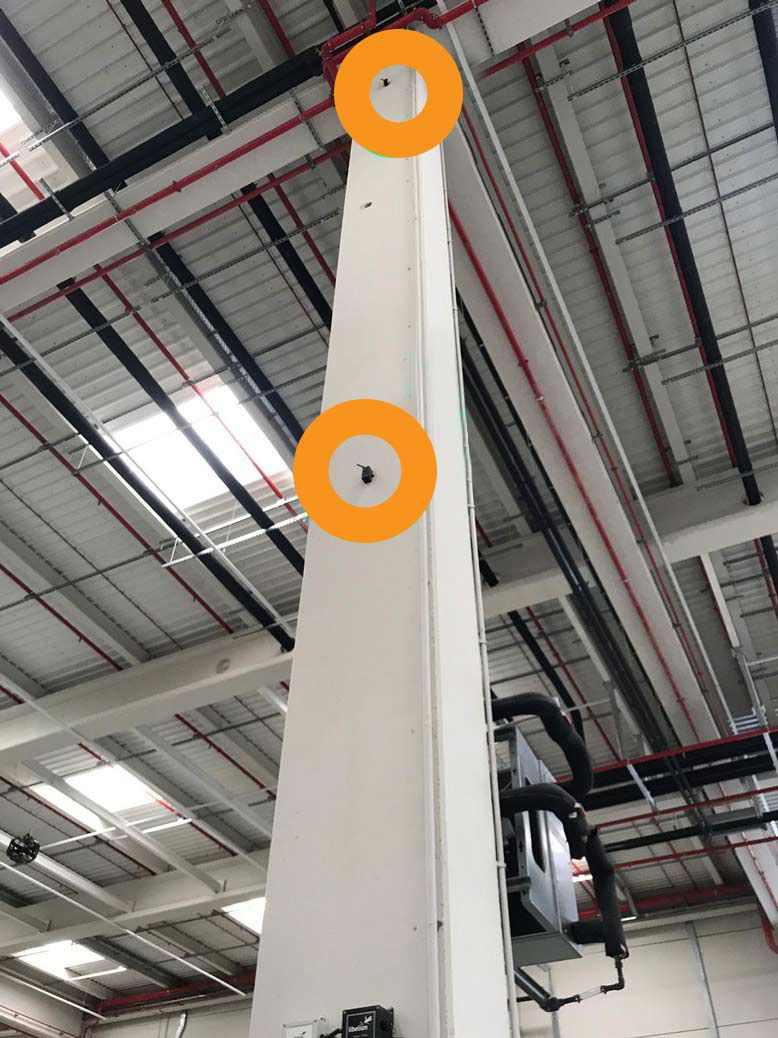
Sensors to be installed throughout the warehouse to ensure the reliability of measurements using Open Mote B
In workplaces, temperature and relative humidity must be kept at a comfort zone by law. In this particular case, the warehouse temperature must be 23-27ºC in summer and 17-24ºC in winter, with typical value of 23ºC. Relative humidity must be within 30-70% around the year, with typical value of 50%.
The temperature and humidity ranges must be controlled automatically and sensors will be installed throughout the warehouse to ensure that the measurements are reliable.
Summary
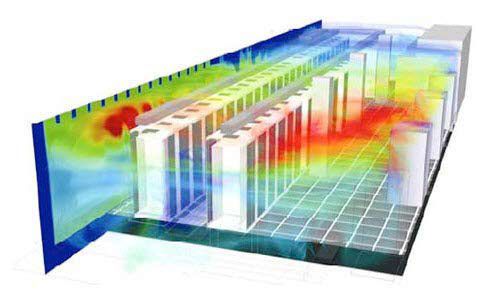
Elevated humidity levels promote the growth of mould, corrosion and rust on stored items. They cause condensation on walls, ceiling and floors, which helps to create conditions suitable for pests. It can also lead to additional insurance costs for mould and mildew claims from customers. During the heat of the day, humidity can be around 30% or lower, but that can be misleading because humidity can reach 70-80% during the night, therefore 24/7 monitoring is required.
Relative humidity (RH) is directly related to the temperature of the air. If the temperature of the warehouse increases, the relative humidity will decrease and vice versa. Relative humidity does not reflect how much water vapour is actually in the air, but it tells how close the air is to being saturated. That is why ideally humidity and temperature should be monitored simultaneously to have the full spectrum of the environmental data.

Engineering challenge
Environmental conditions must be known to determine the necessary hardware. In this specific case, the points to be taken into account are:
-
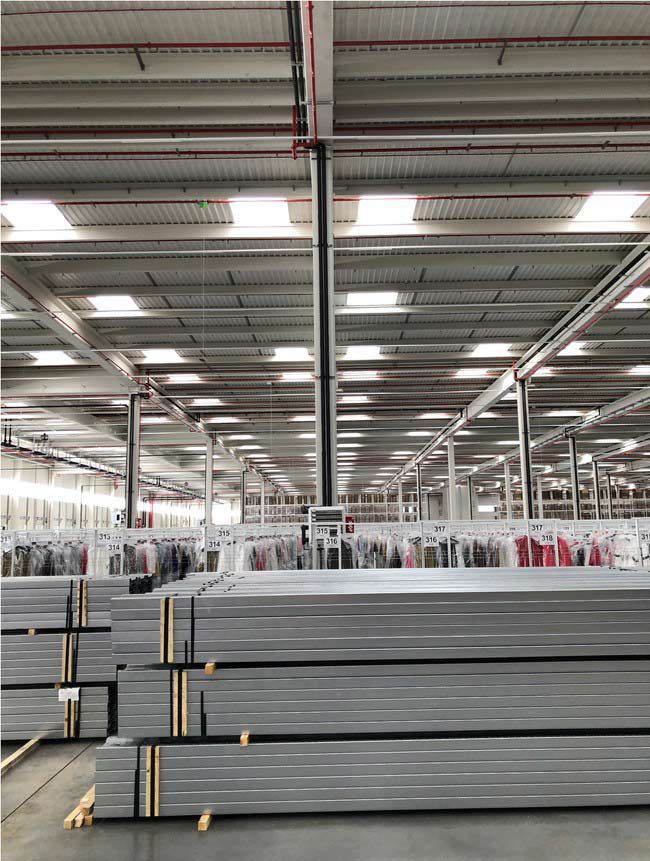
Warehouse measurements: 450x250 meters = 100.000m²
-
Measuring Temperature to 0.1ºC and Relative Humidity to 1% every 1 minute
-
Nodes have to be low-power (>1 year), cheap (<100€) and easy to install (< 15 minutes)
Warehouse overview
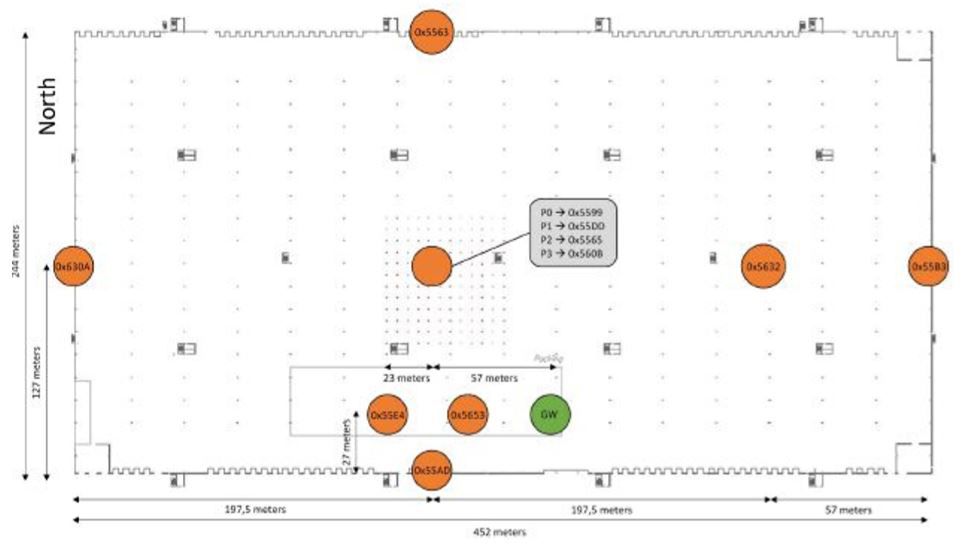
Analyzing the whole structure of the facilities, it has been determined that a total of 11 data collection points must be installed. In them, the relative humidity and ambient temperature data will be taken and sent directly to the Gateway.
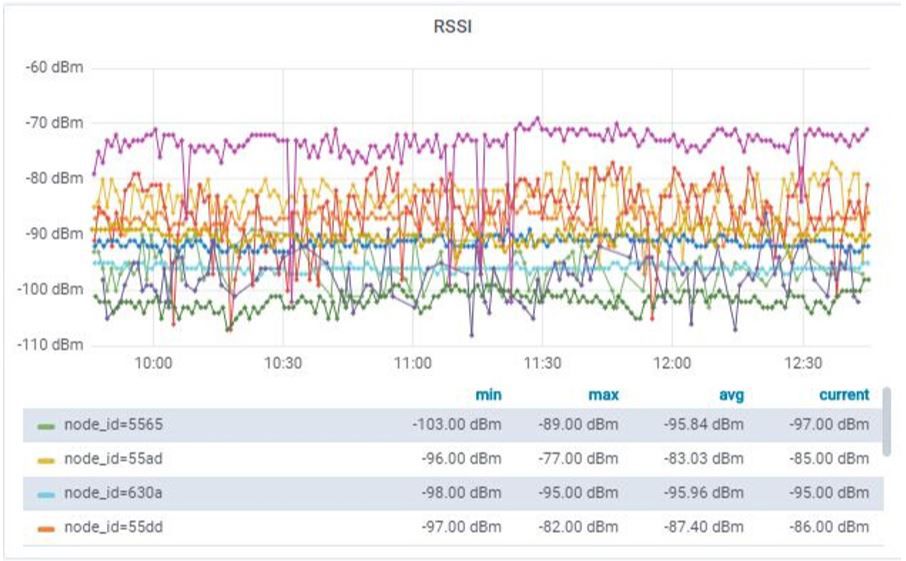
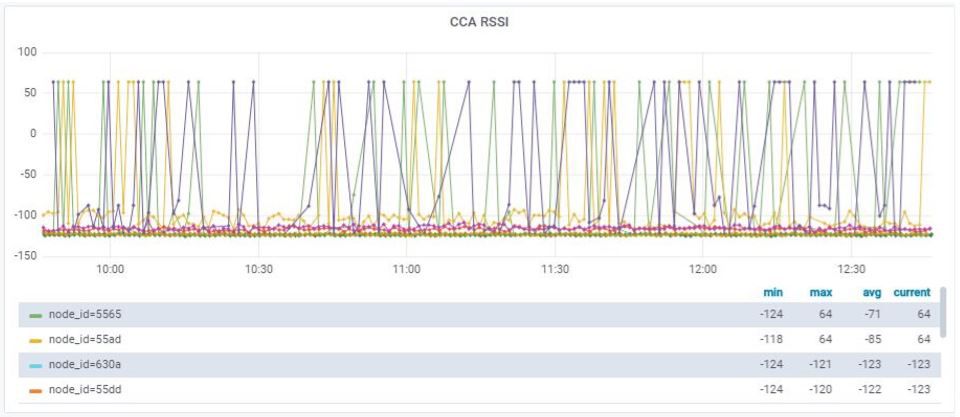
Apart from taking the temperature and relative humidity data, the RSSI and CCA RSSI statuses are also sent periodically to the Gateway to measure the power level of the signals received from each OpenMote B. In this way, we know the status of each device: if one of the modules is failing, it would be detected quickly both the kind of failure and the wrong module.
Deployment Map
On the pictures below you can see the distribution of the 11 data collection points around the warehouse. You can also see the position of the Gateway (green color).
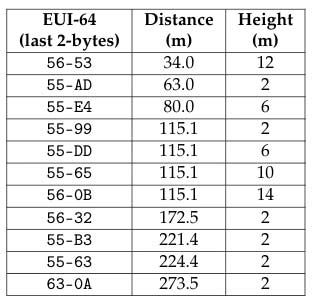
There is also a table attached with the respective OpenMote B distances from the Gateway.
Hardware solution (sensor nodes)
Each data collection point is composed of the following components:
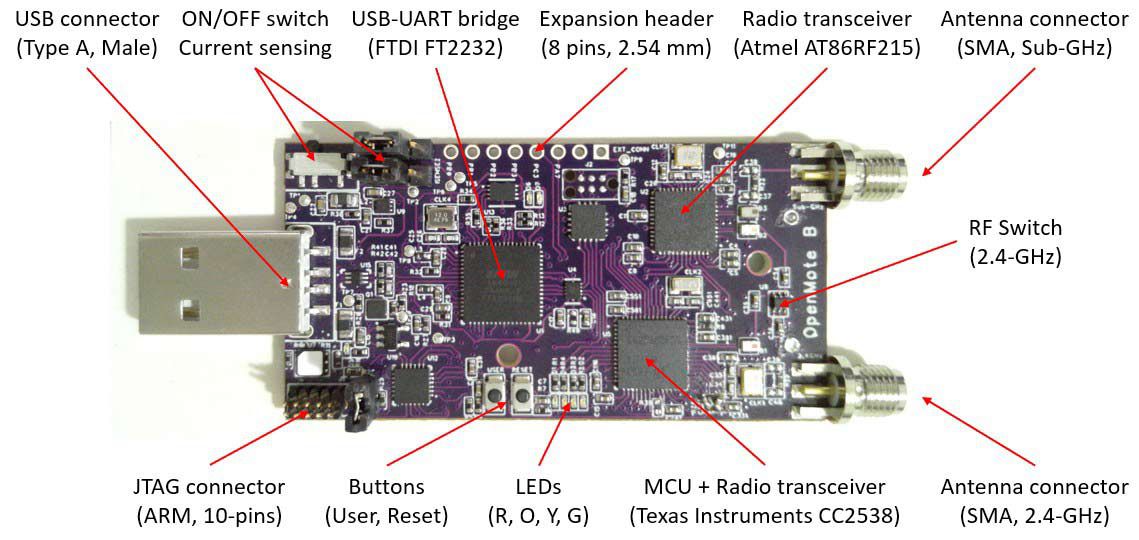
OpenMote-B board
Texas Instruments CC2538
Atmel AT86RF215
2xAA batteries (3V, 1500 mAh)
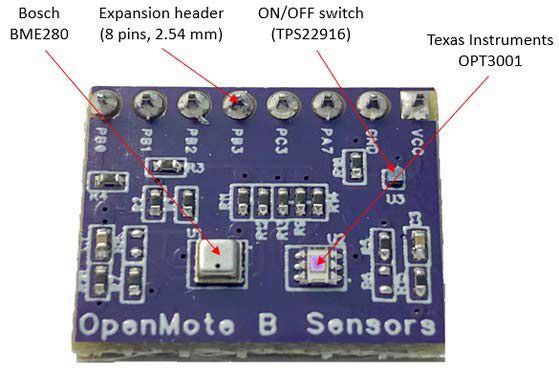
OpenMote-Sensors board
Bosch BME280 (T, RH, P)
Texas Instruments OPT3001 (L)
Sensors have been calibrated with 1-point calibration to remove per-device offset
Hardware solution (Gateway)
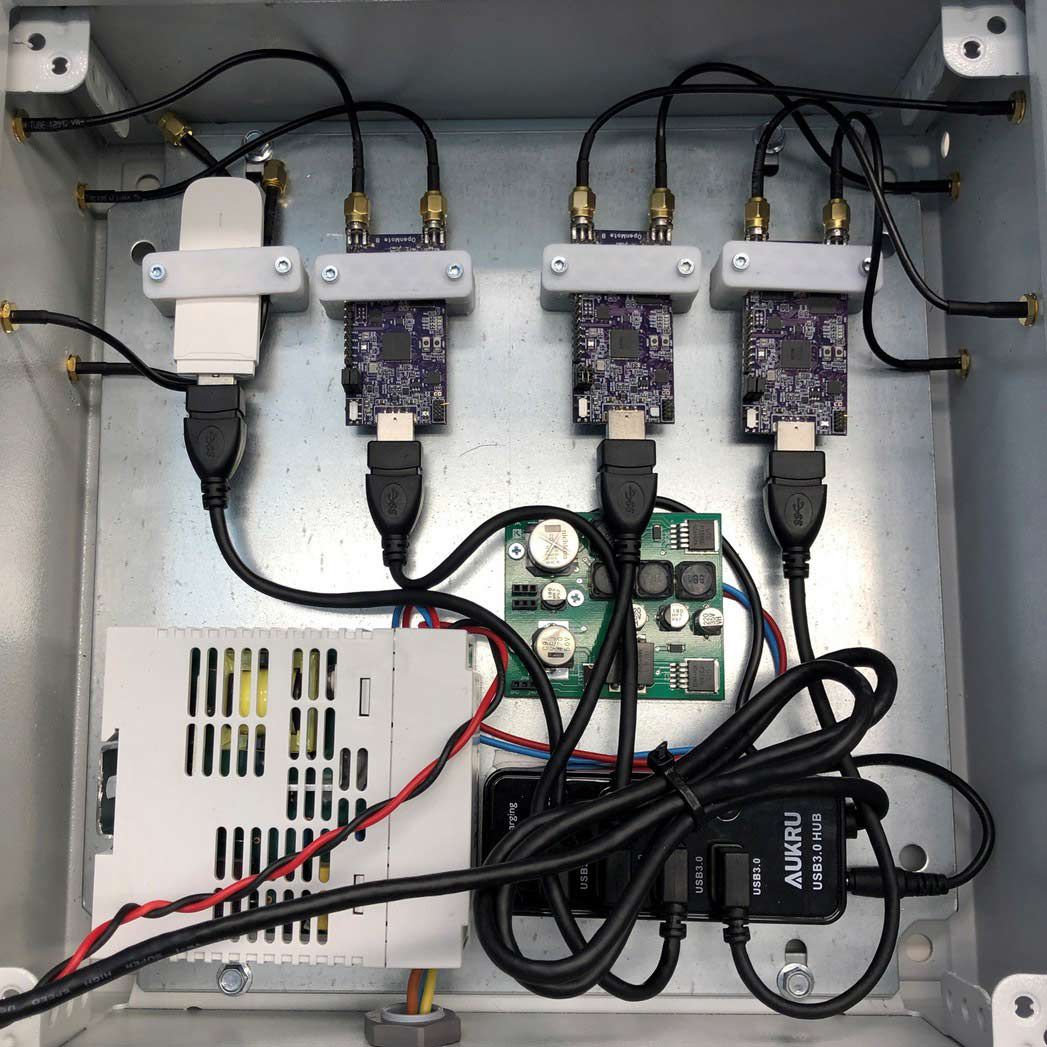
The designed Gateway is composed of the following components:
Gateway Parts:
-
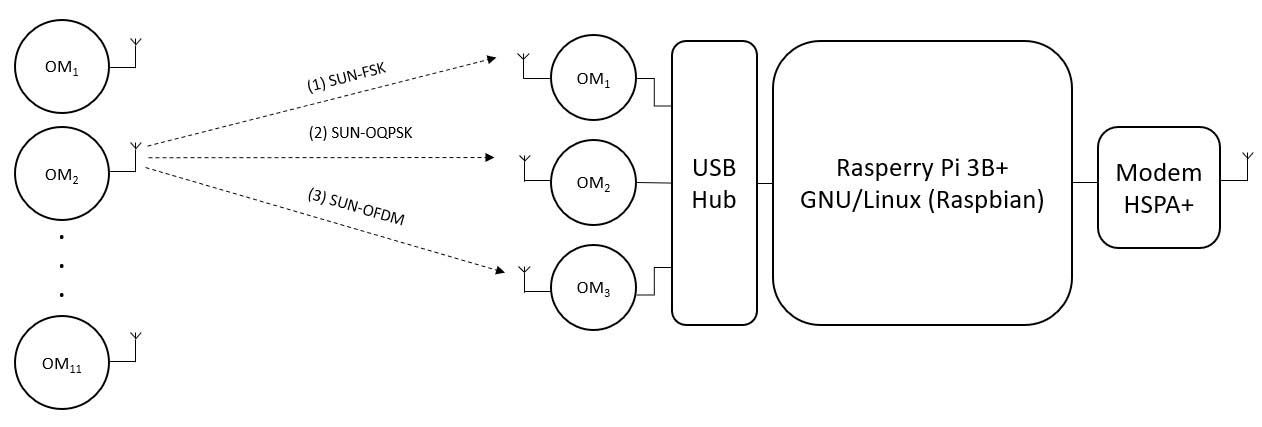
Raspberry Pi 3B+ w/Raspbian
-
3x OpenMote B w/FreeRTO
-
-
SUN-FSK, SUN OQPSK, SUN-OFDM
-
-
1x Huawei E3372 LTE w/ SIM Card (Movistar)
-
Gateway Server w/Python 3
-
-
Serializes data from USB and transmits packets via MQTT
-
Arquitecture solution
The system is inside the cloud; the back-end is deployed in Amazon AWS:
-
T2.Micro instance w/Ubuntu 18.04 LTS
-
-
1x vCPU (Intel Xeon [email protected])
-
1 GByte RAM, 8 GByte Disk
-
-
Cloud-Server w/Python3 (custom)
-
-
Receives data through MQTT, aggregates duplicate packets and performs calibration.
-
-
Node-Red, Grafana & InfluxDB stack
-
Performs Monitoring: data aggregation, storage and representation
Arquitecture solution diagram
Installation
All the installation process was deployed in two phases:
-
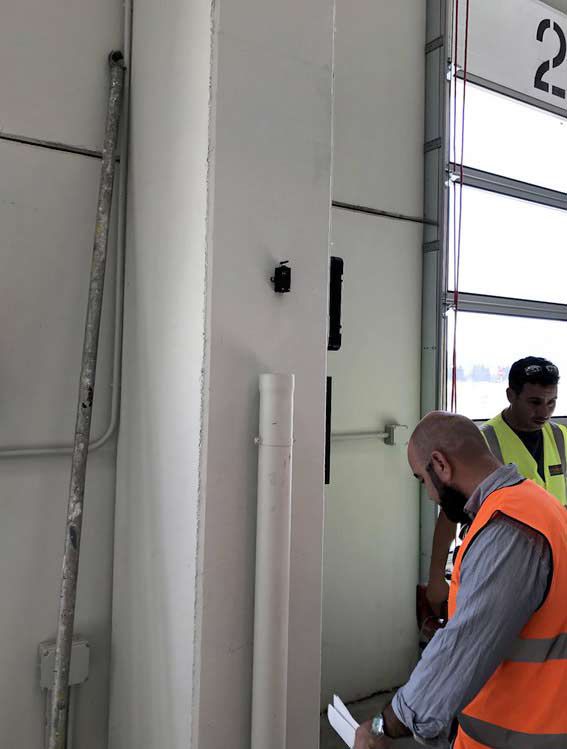
First Phase: (July 16): The Gateway and 5 sensor nodes were installed.
-
Second Phase (July 30): Other 6 sensor nodes were installed to complete deployment.
-
Each node took about 10 minutes maximum to be installed properly.

Solution operation
Every sensor in the network performs the following operation:
-
Waking-up every 60 seconds and sampling the Temperature and Relative Humidity sensors.
-
Preparing the data packet (sensor data) and transmiting it three times (at 100ms, 650ms, 1300ms)
-
In each repetition, the packet is transmitted three times (FSK, OQPSK,OFDM) with 50ms separation

Regardless of modulation, every packet in the network has the following structure:

It is important to consider that:
When transmitting, the packet encodes (FSK, OQPSK, OFDM) and the counter transmits the repetition (1,2,3) for each data collection module.
Packet counter is monotonically increasing and allows to detect packet losses and node resets
Packets are transmitted using CSMA-CA and CCA, with 3 iterations if channel is found busy
Packets are 21 bytes long, but encrypted using AES-128. The final PSDU is always 32 bytes.
CSMA RETRIES inidcates retries for each mode, CSMA RSSI indicates the channel noise when transmitting.
Results
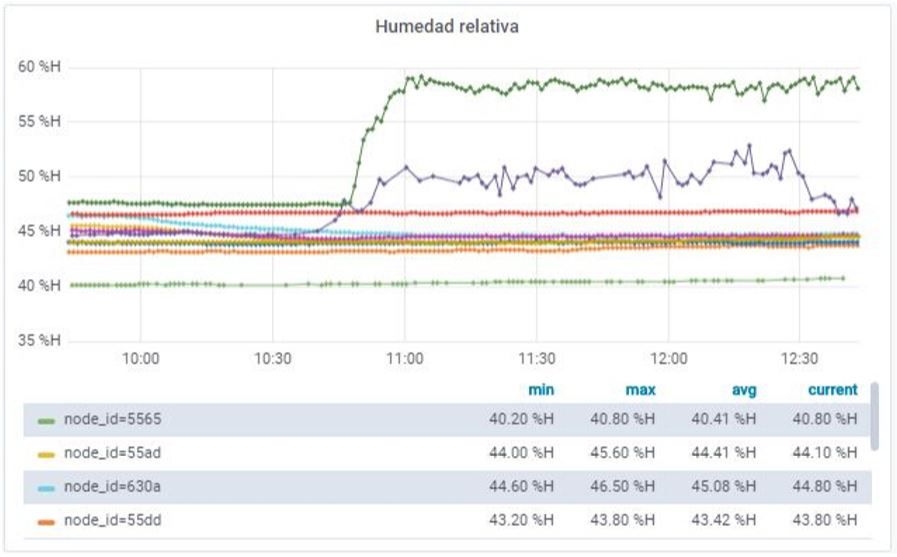
Finally, the main needs that the client marked at the beginning of this project have been met:
-
A system where each wireless data collection node has cost less than € 100 has been achieved.
-
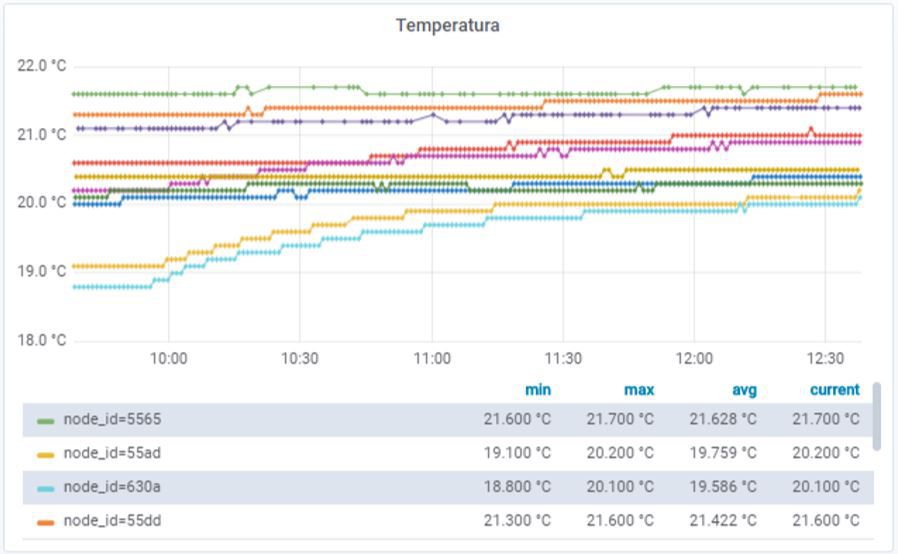
Measurements of both temperature and humidity are obtained simultaneously from the 11 points every minute.
-
Thanks to the sleep method, a lot of battery from the wireless nodes is saved, so they will last more than a year without changing batteries.
-
The average installation time of each node has been shorter than requested (15 min), which has been lowered to 10 min.
-
Additionally, with the study of the RSSI and the CSMA RSSI it is possible to know if any of the nodes have transmission problems and quickly detect a system failure.
Results (monitoring)
Do you want to receive more information?
Just fill the form and we will send you several examples about how to use Open Source based devices on your projects.
