
Introduction
This blog post is only a demonstration of Raspberry PLC's versatility and flexibility. It is compatible with a plethora of services out there in the market and for this blog, we are gathering data from the PLC's inputs and displaying it in real-time on PowerBI's dashboard.
PowereBI's Real-time Datasets
PowerBI has three real-time dataset types, they are:
- Push datasetIn this, when the data is pushed in the PowerBI service, a database is created automatically and therefore reports can be generated. Visuals can be generated with this database in PowerBI's dashboard.
- Streaming datasetIn this case, the data, when pushed in the PowerBI service, it is only stored in the temporary cache of it, which expires quickly. This means that with this stored data only display visuals can be made and no reports or reports based visuals can be generated.
- PubNub streaming datasetWith this, you have to use a PubNub SDK to read an existing PubNub data stream. Here, No data is stored by the PowerBI service. PubNub is a real-time communication platform that provides infrastructure over which real-time chat applications can be built.
We will be using the Streaming dataset to stream our temperature and humidity sensor's output.
The steps to the process are as follows:
1) Register yourself on PowerBi
2) Go to "My Workspace"; Click on new to add a streaming dataset.


3) On clicking the streaming dataset, you will have to choose the API option in the pop up window that appears.


Make sure that you add the timestamp variable as that is important for streaming datatypes and very importantly turn on the Historic data analysis toggle switch.
5) In the next window, you will obtain the API link which will be used to connect your script to the database, therefore copy it and the structure of the key:value pair of the variables you inserted in the previous steps.
6) Your streaming dataset is ready, now we will prepare a dashboard with tiles that will stream your data. To do that, click on "+new" again from step 2 and select "Dashboard" this time.

7) In the Dashboard page, click on edit and add a tile

8) Fill all the required data

9) Choose your streaming dataset

10) You now have to select visualization type and add values to it from the drop down menu. Please repeate this step till all the values from your previously created datasets are fed in.
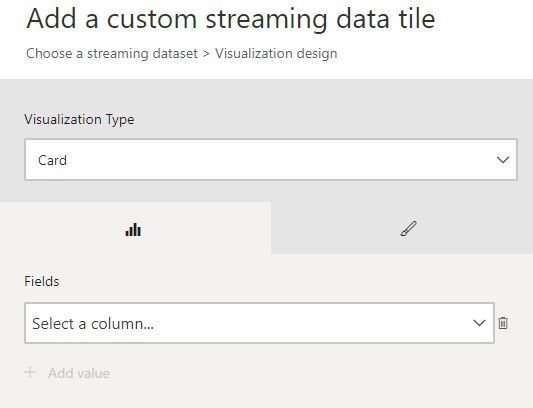
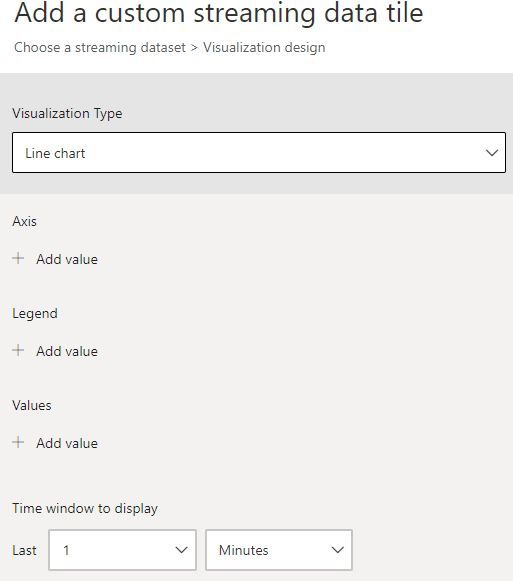
Add the required details in the following steps and you are good to go.
The next steps are only to code the program and add the API link obtained in step 5.
Code
"""
Python sample for Raspberry Pi which reads temperature and humidity values from
a DHT22 sensor, and sends that data to Power BI for use in a streaming dataset.
"""
import urllib3, time
from datetime import datetime
from rpiplc_lib import rpiplc
rpiplc.init("RPIPLC_50RRA")
rpiplc.pin_mode("I0.5",rpiplc.INPUT)
REST_API_URL = 'API LINK'

while True:
    try:
        humidity,temp = dht.read_retry(SENSOR, PIN)
        now=datetime.strftime(datetime.now(), "%Y-%m-%dT%H:%M:%S%Z")
    # data that we're sending to Power BI REST API
        data = '[{{ "timestamp": "{0}", "temperature": {1:0.1f}, "humidity": {2:0.1f} }}]'.format(now, temp, humidity)
        print (data)
    # make HTTP POST request to Power BI REST API
        http = urllib3.PoolManager()
        req = http.request(url=REST_API_URL,method='POST', body=data, headers={'Content-Type':'application/json'})
        response = req.read()
        print("POST request to Power BI with data:{0}".format(data))
        print("Response: HTTP {0} {1}\n".format(response, response))
       # rpiplc.delay(1000)
    except urllib3.exceptions.HTTPError as e:
        print("HTTP Error: {0} - {1}".format(e.code, e.reason))
    except urllib3.exceptions.RequestError as e:
        print("Request Error: {0}".format(e.reason))
    except Exception as e:
        print("General Exception: {0}".format(e))
    except Exception as e:
        print("General Exception: {0}".format(e))
Some Useful Links
1) Big Data Analytics in the Industry 4.0
PowerBI with Raspberry PLC