
An OEE percentage tells you the line ran below target. It does not tell you why. Closing that gap does not require a smarter model, it requires industrial telemetry that already carries the answer: a PLC fault code, a machine, a shift, a machine operating baseline to compare against.
Can an AI answer why your line stopped, or just show you a chart?
An OEE dashboard tells you the line ran at 68% instead of 85%. It does not tell you why. Ask most systems that question directly and you get the same chart back, sometimes with a sentence wrapped around it.
An industrial AI layer can answer that question, but not because the model is smart. It can answer it because the industrial telemetry underneath was tagged well enough to make the question answerable in the first place. That distinction is the point of this post.
A dashboard and an answer are not the same thing
A dashboard shows a number and a trend line. An answer is a root cause: a PLC fault code, a machine, a shift, a pattern that repeats. Most plants have plenty of the first and very little of the second.
Putting a chatbot on top of the same chart does not fix this. If you ask it why the line stopped and it has nothing but the OEE percentage to work with, it will describe the drop in different words. That is not an answer, it is the same chart read out loud.
Structure, not intelligence, is what makes a question answerable
An AI model answers a question about your process the same way a new engineer would on their first day: by looking at what is written down. If nothing links the stop to a cause, a machine and a shift, there is nothing for the model to point to. It will guess, and a guess that sounds confident is worse than no answer at all.
Give it structured, tagged history instead, and the same question becomes easy to answer. Not because the model changed, but because the industrial telemetry now carries what the question needs.
Tagged data means fault code, machine, shift and baseline
In practice, tagging means a handful of fields attached to every reading, not a big data project.
The PLC fault or alarm code, so a stop is a labeled event and not just a gap in the log. The machine or asset ID, so a pattern can be tied to one unit and not the whole line. The shift and timestamp, so a recurring issue at the same hour or with the same crew becomes visible instead of hidden in an average. A machine operating baseline, the normal range for that machine, so a deviation has something to be measured against.
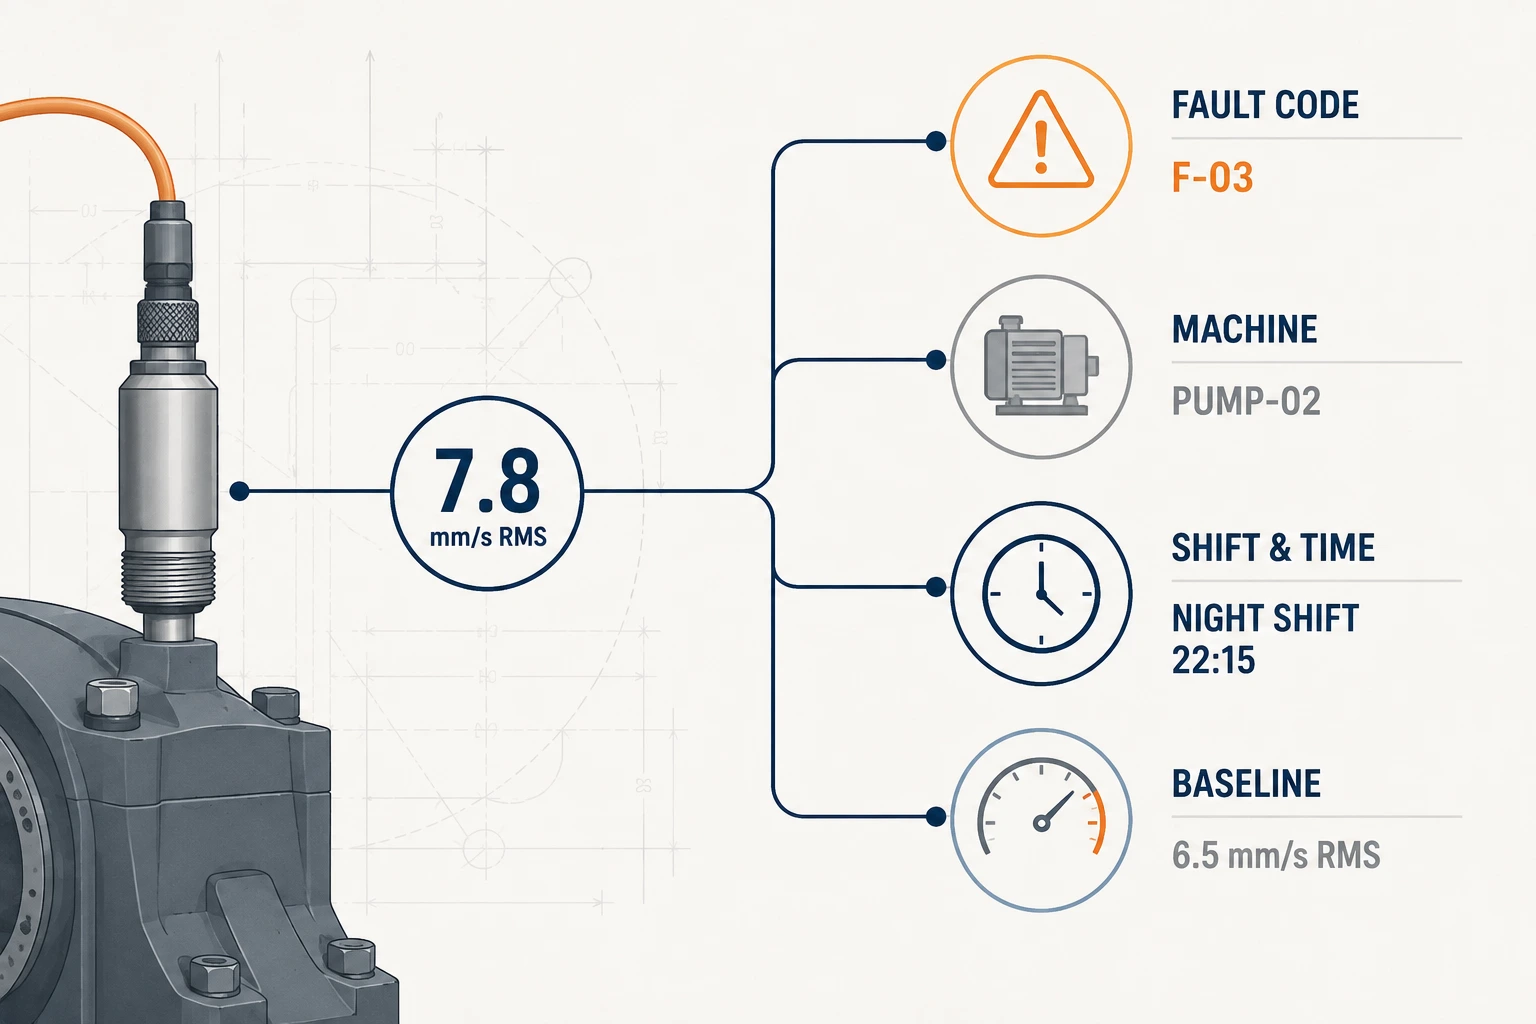
None of this needs to be complex. It needs to be consistent, and it needs to be captured at the source, not reconstructed later from memory or a paper log. This is the same structure that makes condition monitoring and anomaly detection possible later, whether the analysis is a simple threshold rule or a trained AI model.
Open source hardware is what makes this kind of AI integration realistic
Pulling structured, tagged industrial telemetry out of the shop floor is a different job depending on what is running the PLC. On a closed, proprietary stack, it usually means a vendor gateway, a paid license, or a support ticket just to get a PLC fault code out in a format anything else can read.
Industrial Shields hardware is built on the Arduino open ecosystem and standard industrial protocols like Modbus, MQTT and OPC-UA. That means the tagging described above uses documentation, libraries and tools that are already public and already known to most automation engineers, not a closed toolchain controlled by one vendor. The same tagged telemetry can feed a historian, a SCADA system, or an MES, not only an AI layer. That is what makes adding an AI layer later a realistic next step, not a separate integration project.
This data already comes from the retrofit, not a new project
If you read our previous post on retrofitting a legacy PLC, the non-invasive method described there, polling the PLC without touching its logic, is the same place this tagging happens. You are not running a second project to prepare for AI. You are capturing PLC fault code, machine ID, shift and machine operating baseline at the same time you capture the industrial telemetry for IIoT in the first place. In practice, this means a legacy PLC can become AI-ready without a hardware replacement, only a non-invasive retrofit.
This matters because the biggest reason these projects stall is not the machine's age, it is the perceived cost of a second effort. There is no second effort here.
An AI layer changes the search, not the judgment
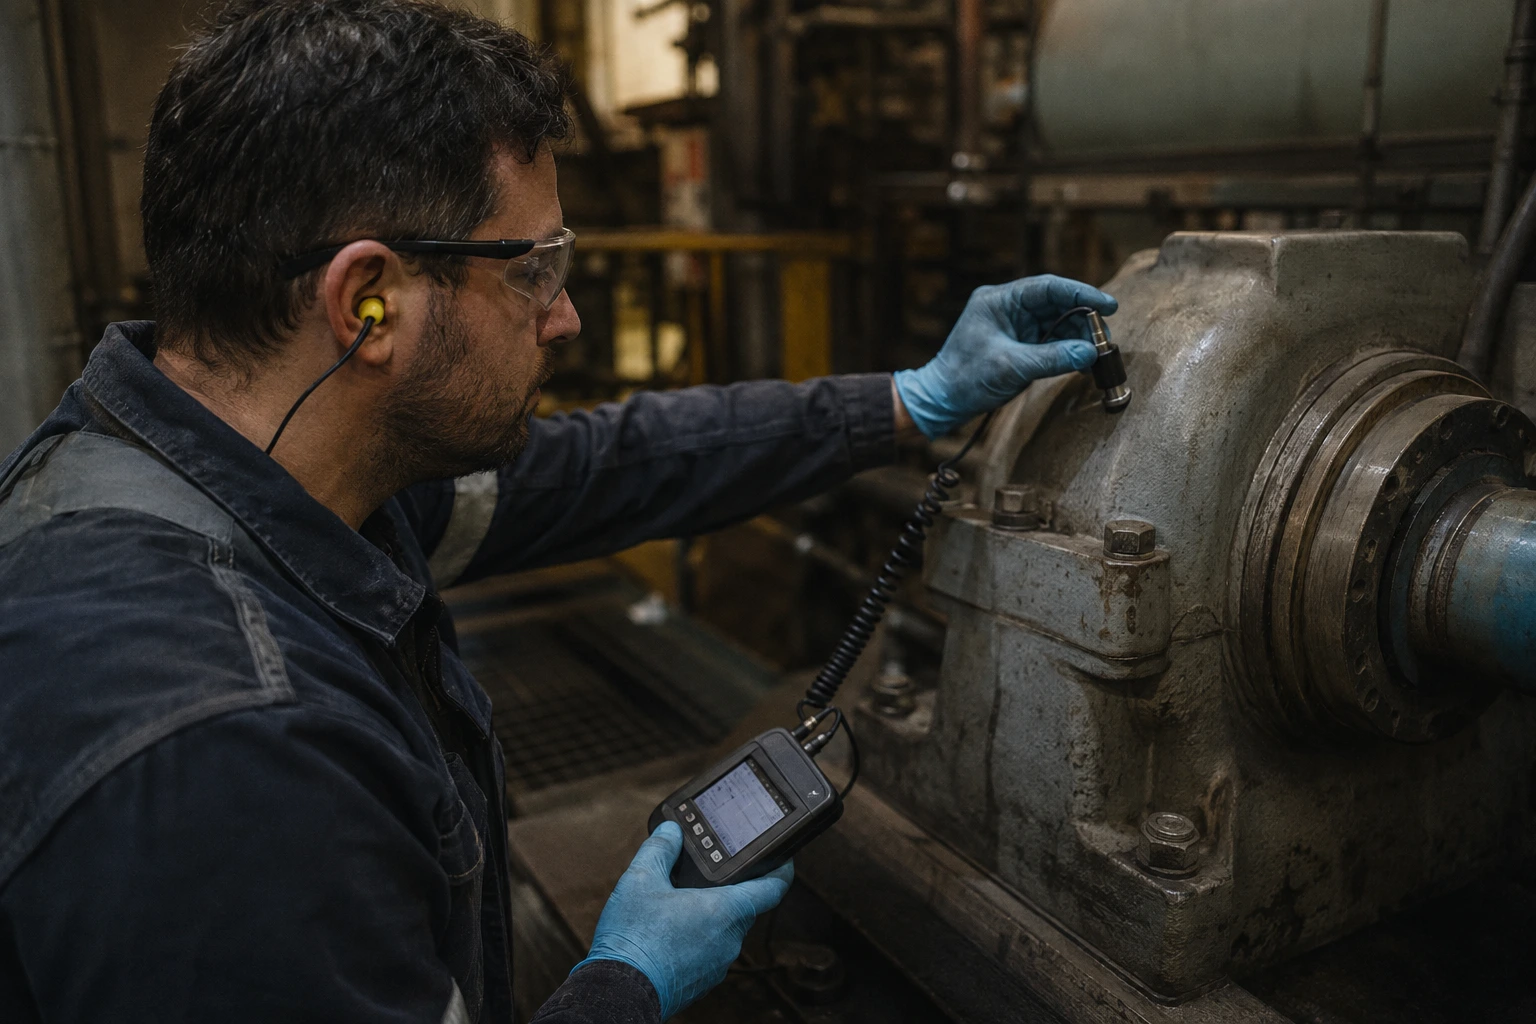
To be clear about what this does and does not do: an AI layer searches tagged history faster than a person can, and it can flag a fault that keeps recurring across shifts, something a single OEE report would never surface. It does not replace the engineer's judgment about what to do next.
One of the largest energy companies in the world already runs this kind of condition monitoring, watching for small deviations, like a blade's pitch drifting from its normal range, across its wind turbines. The same predictive maintenance approach applies to a bearing running hot, a pump losing pressure, or a compressor drawing more current than usual. The AI layer flags the pattern and points to when it started. The decision on whether to schedule maintenance, adjust a setpoint, or let it run still belongs to the person who understands the process.
Get the code: PLC Solution Library
If you want to see non-invasive data capture in practice, the PLC Solution Library has working examples for tagging and reading PLC telemetry with ESP32 PLC and GateBerry. Start there, and the AI layer becomes a question of what you ask the data, not whether you can get it out at all.