Introduction
Node-RED is a programming tool for wiring together hardware devices. APIs and online services in new and interesting ways.
It provides a browser-based editor that makes it easy to wire together flows using the wide range of node in the palette that can be deployed to its runtime in a single-click.
In this post, you will be learn how to dvelop the Node-RED application that was shown in the post linked below:
To know more about Node-RED, please visit https://nodered.org/
Related links
Node-Red basics
As we said in the introduction, Node-RED provides a browser-based editor that makes it easy to wire together flows using the wide range of nodes in the palette that can be deployed to its runtime in a single click.
So, let's go to discover the basics:
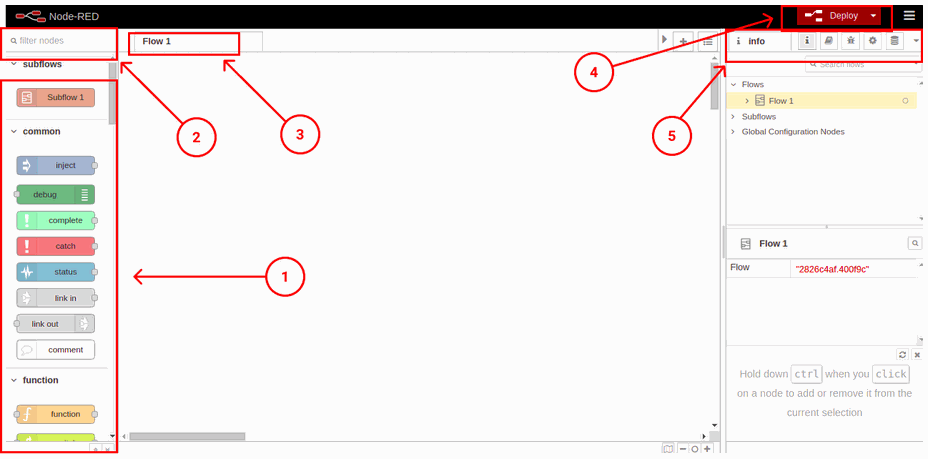
- Node-RED has a wide range of nodes that offers you a lot of possibilities. If you go to the nodes menu on the left, you will find the nodes that come by default. They are easy to use; you just have to drag and drop them in your flow so that you can start using them.
- Moreover, if you already know what node you want, there is a search bar to filter nodes and find exactly the one you want.
- If you double-click on the Flow 1 tab, a configuration window will be displayed, where you can change its name, or disable it, for example. In the same bar, there is a + tab which adds another Flow tab, so that you can use as many as you want.
- Once you have your nodes connected and you want to Deploy your changes, click on the Deploy button.
Next to the Deploy button, there is a menu that allows you to import or export your flows, or if you go to Manage palette > Install, and you type the nodes you want to install, you will be able to download as many nodes as you want, like the node-red-dashboard or the node-red-contrib-ui-media, for example. - Finally, in the right bar where the info tab is displayed, there are more important tabs such as:
- Information: to get general information about the flows.
- Help tab: This gives you information about the node you clicked on.
- Debug messages: this is a really useful tab to know the errors you got, or to display the debug node messages.
- Configuration nodes: It shows the configuration nodes from the flows.
- Dashboard: This tab allows you to set the dashboard layout, tsite configuration and theme.
Our nodes
So, now you know the basics, let's introduce the nodes we are going to use:
- Ui_button node: Adds a button to the user interface. Clicking the button generates a message with msg.payload set to the Payload field. If no payload is specified, the node id is used.
- Function node: A JavaScript function to run against the messages being received by the node. The messages are passed in as a JavaScript object called msg. By convention, it will have a msg.payload property containing the body of the message.
- Exec node: Runs a system command and returns its output. The node can be configured to either wait until the command completes, or to send its output as the command generates it. The command that is run can be configured in the node or provided by the received message.
- Change node: Set, change, delete or move properties of a message, flow context or global context. The node can specify multiple rules that will be applied in the order they are defined.
- Switch node: Route messages based on their property values or sequence position.
- Ui_chart node: Plots the input values on a chart. This can either be a time based line chart, a bar chart (vertical or horizontal), or a pie chart.
- Ui_gauge node: Adds a gauge type widget to the user interface. The msg.payload is searched for a numeric value and is formatted in accordance with the defined Value Format.
- Ui_media node: Displays media files and URLs on the Dashboard.
- Status node: Report status messages from other nodes on the same tab.
Getting the weight value
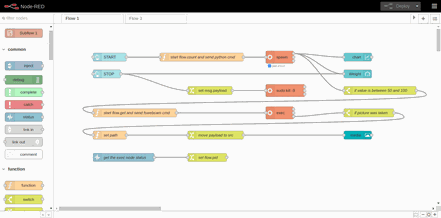
What we are going to do is to start getting the values from a weight sensor, and when the application founds the value we set, the USB camera will take a picture.
So, let's start developing our application!
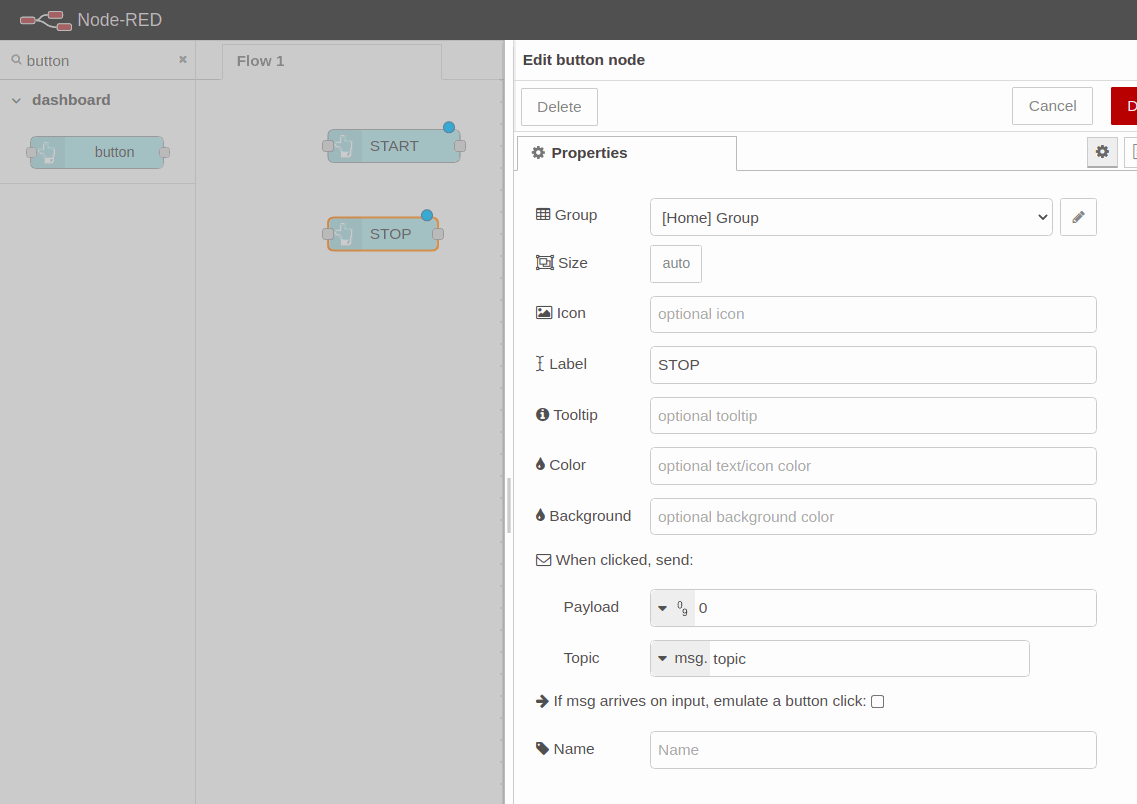
1. First of all, you are going to add two dashboard buttons: the first one to start the application, and the other one to stop it.
So, go the filter nodes search bar and type: button. Add two buttons to the flow, and double-click to edit them.
In the first one, you must create a UI Group and a UI Tab to display our dashboard. Once done, it will work for all the Dashboard nodes, so it is only necessary once. After that, you will type a label to be displayed, in our case: START.
Likewise, the STOP button will have the same configuration; you will select the group and tab where you want to display it, you will type: STOP as a label and we will add a 0 to the payload, so that the value for the gauge sets to 0 when the application stops, instead of stopping in the last value.
2. You are going to add a function node next to the start button and wire it.
In the start node, you are going to initialize a flow variable named count to 0, which you are going to use later on when you name the pictures, and you are going to send the message with the command to execute for the app to start.
var count = flow.get('count')||0;flow.set('count', count);var newMsg = {payload: "python -u /home/pi/hx711py/example.py"};return newMsg;
You can give a name to the function node as you would like to see it in your flow. In this case: start flow.count and send python cmd. Finally, wire an Exec node and edit it. Select the output: "while the command is running - spawn mode", and click on the checkbox to append the msg.payload.
3. When there is an exec node running as spawn mode, that generates a pid of the running process, you will have to get to be able to kill it. So that is what you are going to do right now.
Add a status node, go to "Report status from" and select "Selected nodes". Choose the exec node, and click on Done. After that, wire a Change node, and edit it to set the flow.pid as shown below:
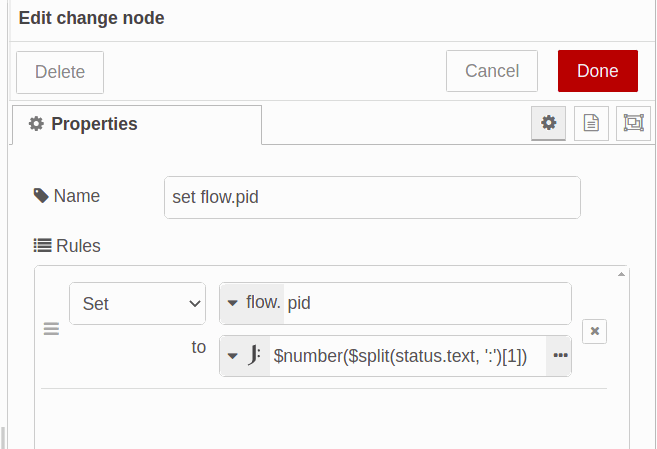
Finally, add another change node next to the stop button and connect them. As we set the flow.pid in the previous change node, now we are going to set the msg.payload to flow.pid. By doing this, when you click on the Stop button, the msg.payload will be sent through the node.
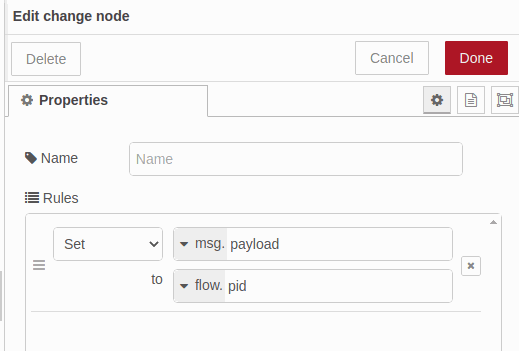
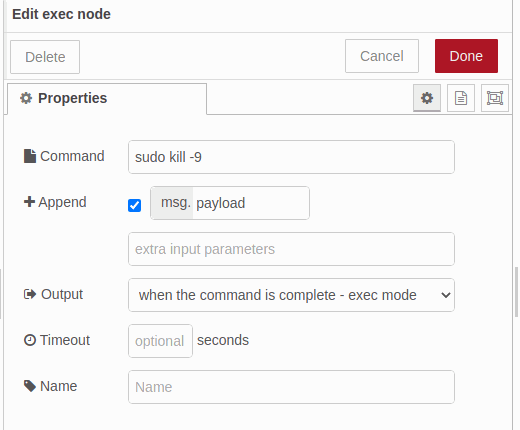
So, now the pid is the msg.payload. Add an exec node as an exec mode to kill the pid, and edit it:
At the moment, your flow will look like:
[{"id":"2826c4af.400f9c","type":"tab","label":"Flow 1","disabled":false,"info":""},{"id":"bce0df4f.bc788","type":"ui_button","z":"2826c4af.400f9c","name":"","group":"c4c1bcc1.49c24","order":16,"width":"7","height":"2","passthru":false,"label":"START ","tooltip":"","color":"","bgcolor":"","icon":"","payload":"","payloadType":"str","topic":"topic","topicType":"msg","x":140,"y":140,"wires":[["882b392c.ab71b8"]]},{"id":"222e70bc.56f6","type":"ui_button","z":"2826c4af.400f9c","name":"","group":"c4c1bcc1.49c24","order":15,"width":0,"height":0,"passthru":false,"label":"STOP","tooltip":"","color":"","bgcolor":"","icon":"","payload":"0","payloadType":"num","topic":"topic","topicType":"msg","x":130,"y":220,"wires":[["63e42d5b.dee384"]]},{"id":"882b392c.ab71b8","type":"function","z":"2826c4af.400f9c","name":"start flow.count and send python cmd","func":"var count = flow.get('count')||0;\nflow.set('count', count);\n\nvar newMsg = {payload: \"python -u /home/pi/hx711py/example.py\"};\nreturn newMsg;","outputs":1,"noerr":0,"initialize":"","finalize":"","libs":[],"x":410,"y":140,"wires":[["9628a2eb.2a5d3"]]},{"id":"2abcf1ce.f1931e","type":"status","z":"2826c4af.400f9c","name":"","scope":["9628a2eb.2a5d3"],"x":140,"y":60,"wires":[["b7fab428.f4fb78"]]},{"id":"9628a2eb.2a5d3","type":"exec","z":"2826c4af.400f9c","command":"","addpay":"payload","append":"","useSpawn":"true","timer":"","oldrc":false,"name":"","x":690,"y":140,"wires":[[],[],[]]},{"id":"b7fab428.f4fb78","type":"change","z":"2826c4af.400f9c","name":"","rules":[{"t":"set","p":"pid","pt":"flow","to":"$number($split(status.text, ':')[1])","tot":"jsonata"}],"action":"","property":"","from":"","to":"","reg":false,"x":410,"y":60,"wires":[[]]},{"id":"63e42d5b.dee384","type":"change","z":"2826c4af.400f9c","name":"","rules":[{"t":"set","p":"payload","pt":"msg","to":"pid","tot":"flow"}],"action":"","property":"","from":"","to":"","reg":false,"x":420,"y":220,"wires":[["46ba8b75.815004"]]},{"id":"46ba8b75.815004","type":"exec","z":"2826c4af.400f9c","command":"sudo kill -9","addpay":"payload","append":"","useSpawn":"false","timer":"","oldrc":false,"name":"","x":690,"y":220,"wires":[[],[],[]]},{"id":"c4c1bcc1.49c24","type":"ui_group","name":"Group","tab":"cbda5f28.c75ad","order":1,"disp":true,"width":"20","collapse":false},{"id":"cbda5f28.c75ad","type":"ui_tab","name":"Home","icon":"dashboard","disabled":false,"hidden":false}]4. Now, you are going to see the values from the last 1 hour in a line chart, and also in real time in a gauge.
Then, drag and drop a chart node and a gauge node, and let's edit them.
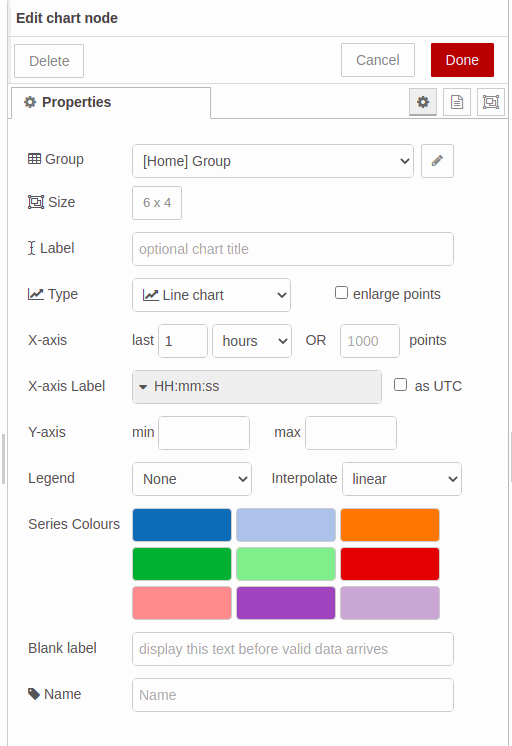
In the chart node, set de X-axis to the last 1 hour, or the time you would like to register, add the Tab and Group you would like to display in and click on Done.
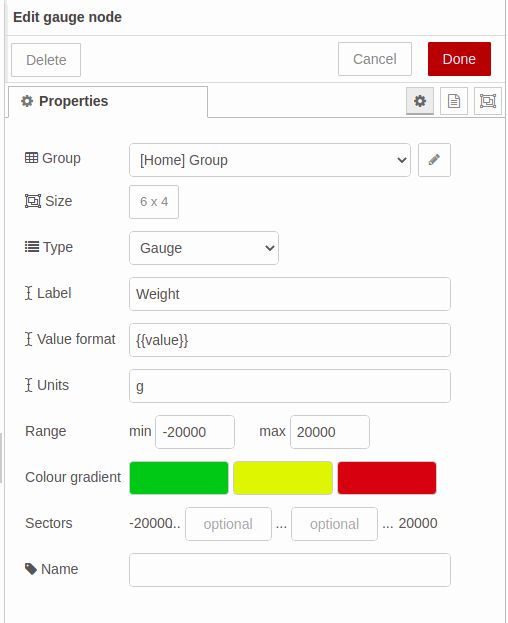
Edit the gauge node by choosing the same Tab and Group and setting a label to display as its title, also type the units. Finally, set the minimum and the maximum value to set the range:
Finally, connect them as shown below:
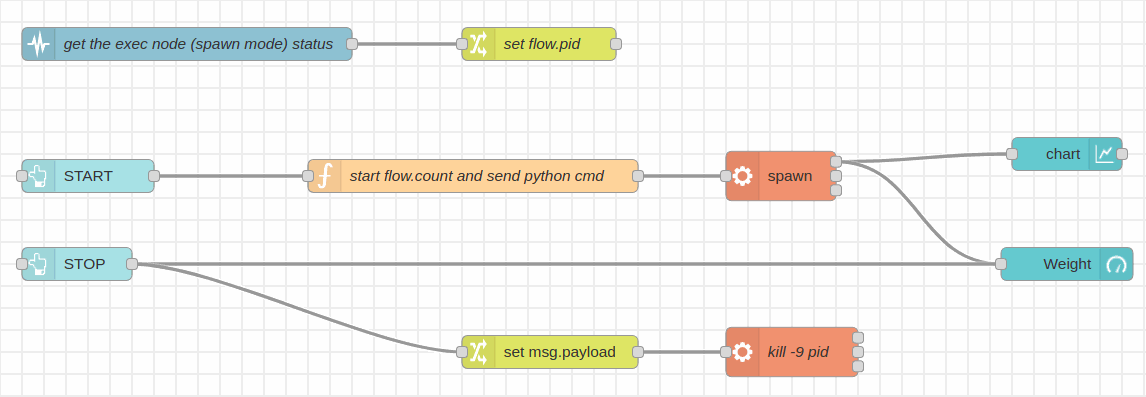
Weight! Picture this!
var count = flow.get('count'); count++;
msg.payload = "fswebcam -r 1280x720 --no-banner /home/pi/images/image" + count + ".jpg";
flow.set('count', count); return msg;
You should add three parameters to the fswebcam command:
a. - r to set the photo resolution.
b. --no-banner to skip the camera banner
c. The path to saying where to save the images, and what name they are going to receive.
7. The function node will send a msg.payload, so you are going to add an exec node appending the msg.payload to execute the command in your industrial Raspberry Pi PLC controller.
8. The exec mode has three outputs. The first one returns the stdout, the second one returns the stderr and the last one, returns the return code. So in this case, connect the third output, the return code, to a switch node to continue with the flow if there was no error.
So, in the switch node, set the property to msg.payload.code and set the value rule to equal number 0, to be sure that the fwwebcam command was executed with no errors.
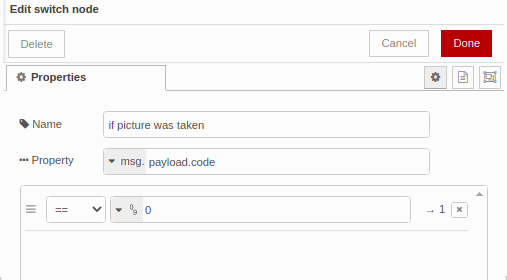
9. After that, connect a function node to send the name of the picture it was just taken, so that it can be displayed in the Node-RED Dashboard. Once edited as shown below, connect a change node to move the msg.payload to msg.src:
let count = flow.get('count');
msg.payload = "/image" + count + ".jpg";
return msg;
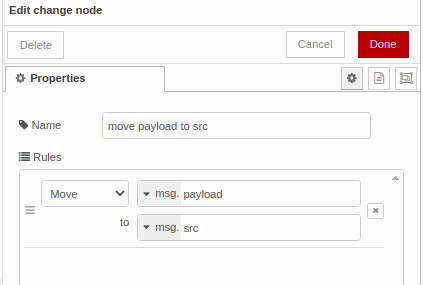
10. Finally, add the media node and just add a Group to it, or configure the layout as you want.
Now, your Node-RED application should look like this:
[{"id":"2826c4af.400f9c","type":"tab","label":"Flow 1","disabled":false,"info":""},{"id":"9b234a13.0256e8","type":"exec","z":"2826c4af.400f9c","command":"","addpay":"payload","append":"","useSpawn":"false","timer":"","oldrc":false,"name":"","x":510,"y":260,"wires":[[],[],["3f27e8b4.d02378"]]},{"id":"ec5481a.4fbf28","type":"exec","z":"2826c4af.400f9c","command":"","addpay":"payload","append":"","useSpawn":"true","timer":"","oldrc":false,"name":"","x":870,"y":60,"wires":[["36307784.3144e8","372e8f7b.f9752","d4e34cd5.f423e"],[],[]]},{"id":"36307784.3144e8","type":"switch","z":"2826c4af.400f9c","name":"if value is between 50 and 100","property":"payload","propertyType":"msg","rules":[{"t":"btwn","v":"50","vt":"num","v2":"100","v2t":"num"}],"checkall":"true","repair":false,"outputs":1,"x":990,"y":160,"wires":[["fb666c7f.c2ff9"]]},{"id":"3f27e8b4.d02378","type":"switch","z":"2826c4af.400f9c","name":"if picture was taken","property":"payload.code","propertyType":"msg","rules":[{"t":"eq","v":"0","vt":"num"}],"checkall":"true","repair":false,"outputs":1,"x":1030,"y":260,"wires":[["7646b60e.83a318"]]},{"id":"7646b60e.83a318","type":"function","z":"2826c4af.400f9c","name":"set path","func":"let count = flow.get('count');\nmsg.payload = \"/image\" + count + \".jpg\";\nreturn msg;","outputs":1,"noerr":0,"initialize":"","finalize":"","libs":[],"x":140,"y":360,"wires":[["a4078c82.e803a"]]},{"id":"a4078c82.e803a","type":"change","z":"2826c4af.400f9c","name":"move payload to src","rules":[{"t":"move","p":"payload","pt":"msg","to":"src","tot":"msg"}],"action":"","property":"","from":"","to":"","reg":false,"x":560,"y":360,"wires":[["3385b59c.06c81a"]]},{"id":"8771f8be.e44f68","type":"ui_button","z":"2826c4af.400f9c","name":"","group":"c4c1bcc1.49c24","order":5,"width":7,"height":2,"passthru":false,"label":"STOP LOAD CELL","tooltip":"","color":"","bgcolor":"","icon":"","payload":"0","payloadType":"num","topic":"","topicType":"str","x":170,"y":160,"wires":[["e053ecae.bca31","d4e34cd5.f423e"]]},{"id":"d4e34cd5.f423e","type":"ui_gauge","z":"2826c4af.400f9c","name":"","group":"c4c1bcc1.49c24","order":13,"width":6,"height":4,"gtype":"gage","title":"Weight","label":"g","format":"{{value}}","min":"-2000","max":"2000","colors":["#00b500","#e6e600","#ca3838"],"seg1":"","seg2":"","x":1070,"y":100,"wires":[]},{"id":"372e8f7b.f9752","type":"ui_chart","z":"2826c4af.400f9c","name":"","group":"c4c1bcc1.49c24","order":11,"width":6,"height":4,"label":"","chartType":"line","legend":"false","xformat":"HH:mm:ss","interpolate":"linear","nodata":"","dot":false,"ymin":"","ymax":"","removeOlder":1,"removeOlderPoints":"","removeOlderUnit":"3600","cutout":0,"useOneColor":false,"useUTC":false,"colors":["#1f77b4","#aec7e8","#ff7f0e","#2ca02c","#98df8a","#d62728","#ff9896","#9467bd","#c5b0d5"],"outputs":1,"useDifferentColor":false,"x":1070,"y":60,"wires":[[]]},{"id":"99be7e29.78696","type":"ui_button","z":"2826c4af.400f9c","name":"","group":"c4c1bcc1.49c24","order":3,"width":7,"height":2,"passthru":false,"label":"START LOAD CELL","tooltip":"","color":"","bgcolor":"","icon":"","payload":"","payloadType":"str","topic":"","topicType":"str","x":180,"y":60,"wires":[["615b1ef6.53963"]]},{"id":"615b1ef6.53963","type":"function","z":"2826c4af.400f9c","name":"start flow.count and send python cmd","func":"var count = flow.get('count')||0;\nflow.set('count', count);\n\nvar newMsg = {payload: \"sudo python -u /home/pi/hx711py/example.py\"};\nreturn newMsg;","outputs":1,"noerr":0,"initialize":"","finalize":"","libs":[],"x":610,"y":60,"wires":[["ec5481a.4fbf28"]]},{"id":"3385b59c.06c81a","type":"ui_media","z":"2826c4af.400f9c","group":"c4c1bcc1.49c24","name":"","width":6,"height":4,"order":15,"category":"","file":"","layout":"expand","showcontrols":true,"loop":true,"onstart":false,"scope":"local","tooltip":"","x":1070,"y":360,"wires":[[]]},{"id":"16de31a2.e4a6de","type":"status","z":"2826c4af.400f9c","name":"get the exec node status","scope":["ec5481a.4fbf28"],"x":190,"y":600,"wires":[["9bb820b3.87fbe"]]},{"id":"9bb820b3.87fbe","type":"change","z":"2826c4af.400f9c","name":"set flow.pid","rules":[{"t":"set","p":"pid","pt":"flow","to":"$number($split(status.text, ':')[1])","tot":"jsonata"}],"action":"","property":"","from":"","to":"","reg":false,"x":410,"y":600,"wires":[["b99c988c.86bf98"]]},{"id":"b99c988c.86bf98","type":"function","z":"2826c4af.400f9c","name":"set kill cmd","func":"let pid = flow.get('pid');\nvar kill = \"kill -9 \" + pid;\nflow.set('kill', kill);\nreturn msg;","outputs":1,"noerr":0,"initialize":"","finalize":"","libs":[],"x":590,"y":600,"wires":[[]]},{"id":"e053ecae.bca31","type":"function","z":"2826c4af.400f9c","name":"killall python","func":"msg.payload = \"sudo killall python\";\nreturn msg;","outputs":1,"noerr":0,"initialize":"","finalize":"","libs":[],"x":530,"y":160,"wires":[["ec5481a.4fbf28"]]},{"id":"fb666c7f.c2ff9","type":"function","z":"2826c4af.400f9c","name":"start flow.get and send fswebcam cmd","func":"var count = flow.get('count');\ncount++;\n\nmsg.payload = \"fswebcam -r 1280x720 --no-banner /home/pi/images/image\" + count + \".jpg\";\n\nflow.set('count', count);\n\nreturn msg;\n\n","outputs":1,"noerr":0,"initialize":"","finalize":"","libs":[],"x":230,"y":260,"wires":[["9b234a13.0256e8"]]},{"id":"5771d86a.220b58","type":"comment","z":"2826c4af.400f9c","name":"In case you want to kill the flow pid and not the python processes, replace the \"killall python\" function node, for the \"killall pid\" function node -->","info":"","x":550,"y":540,"wires":[]},{"id":"b88b67eb.03f068","type":"function","z":"2826c4af.400f9c","name":"killall pid","func":"msg.payload = flow.get('kill');\nreturn msg;","outputs":1,"noerr":0,"initialize":"","finalize":"","libs":[],"x":1100,"y":540,"wires":[[]]},{"id":"c4c1bcc1.49c24","type":"ui_group","name":"","tab":"cbda5f28.c75ad","order":1,"disp":true,"width":"20","collapse":false},{"id":"cbda5f28.c75ad","type":"ui_tab","name":"Home","icon":"dashboard","disabled":false,"hidden":false}]
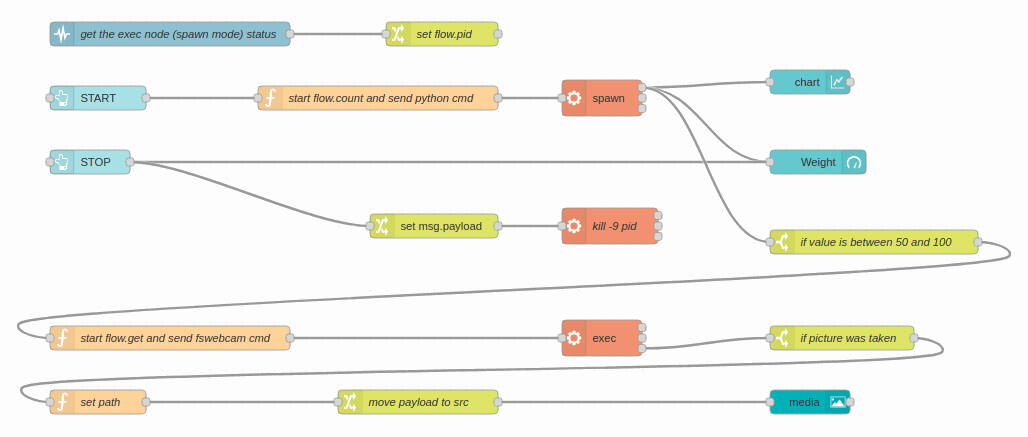
Tips
If you go to the right menu, in the Dashboard tab, and you hover on your tab, you will see appear three buttons: group, edit and layout. So, if you click on layout, you will see the Dashboard layout editor, where it is possible to display your ui nodes as you want.
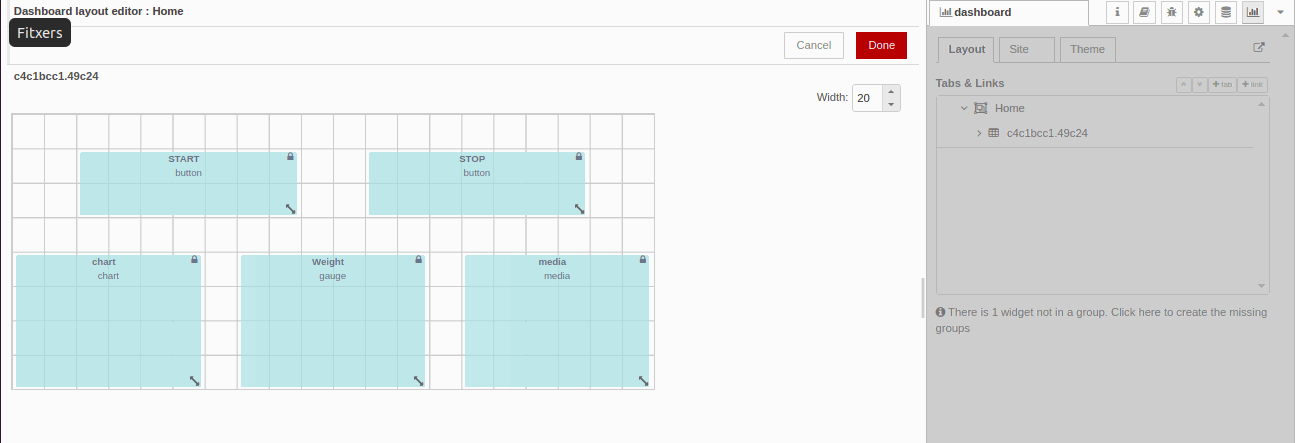
If you see that you cannot resize the widgets, go to every Dashboard node, and in the Size section, you will see that is set as auto, so just set any manual size, go back to the Dashboard layout editor, where the changes will be applied.
Finally, go to http://10.10.10.20:1880/ui/ to check out your Node-RED dashboard!
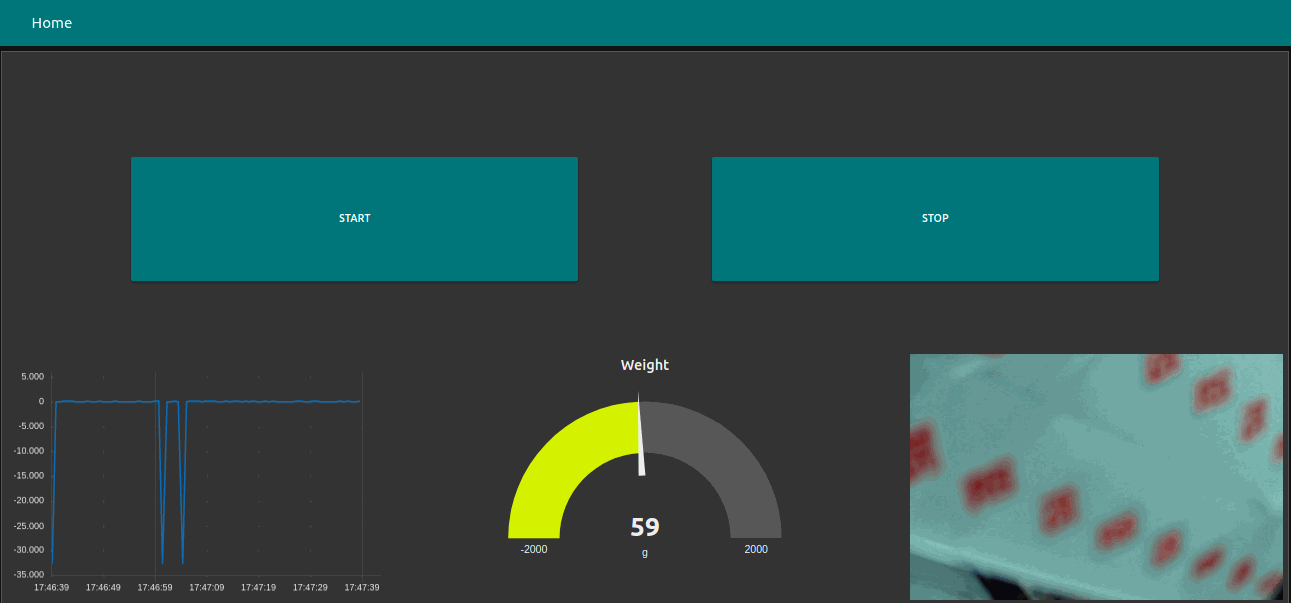
Node-RED & Raspberry tutorial: How to capture data from sensor