Introducción
Node-RED is a powerful, open-source visual programming tool designed to simplify the process of wiring together hardware devices, APIs, and online services in new and innovative ways.Node-RED provides a browser-based editor that enables users to create flows using a wide range of nodes representing various functionalities.
If you are used to Node-red and its dashboards, you know that it has a short and limited variety of user interfaces which sometimes are quite suitable for your dashboard design.
In this post we will show how to make your own designs for your dashboard using CSS and HTML.
Creating your design in CSS and HTML
First of all we need to think about the design we want to implement in our dashboard. In this post we are going to design a silo that is used as a gauge. To create de design in CSS and HTML and see the the result in real time we recommend to use CodePen.
En CSS se recomienda crear una clase principal (master class) que defina los parámetros de tamaño máximo del diseño, y el resto de partes como clases hijas. Implementar este método facilitará el escalado del diseño completo en el dashboard.
CSS CODE
.master-container{height: 1100px;
width: 500px;
position: relative;
background-color: ;
transform: scale(0.8); /*Variable scale for Node-Red dashboard*/}
.base_child {height: 50px;
width: 500px;
bottom: 0px;
position: absolute;
background-color: #808070;
}
.container_child{height: 800px;
width: 450px;
background-color: #808080;
  bottom: 20PX;
  left: 25px;
position: absolute;
z-index: 1;
background: linear-gradient(to bottom, #D3D3D3, #A9A9A9, #808080);
}
.trapezoid_child {border-bottom: 95px solid #4B4B4B;
border-left: 80px solid transparent;
border-right: 80px solid transparent;
bottom: 1000px;
width: 294px;
left: 23px;
z-index: -1;
position: absolute;
}
.leg_child_left{height: 150px;
width: 50px;
background-color: #4B4B4B;
bottom: 50px;
position: absolute;
left: 25px;
}
.leg_child_right{height: 150px;
width: 50px;
background-color: #4B4B4B;
bottom: 50px;
position: absolute;
right: 25px;
}
.inverted_trapezoid_child{border-bottom: 80px solid #4B4B4B;
border-left: 160px solid transparent;
border-right: 160px solid transparent;
bottom: 122px;
width: 30px;
left: 75px;
z-index: 6;
position: absolute;
transform: scaleY(-1);
}
/* Percentage and gauge design */
.liquid { /*Gauge*/background-color: #017B92;
position: absolute;
bottom: 0px;
left: 5%;
width: 90%;
transition: height 0.8s;
z-index: 2
}
.quantity_child{ /*Percentage value displayed*/content: attr(data-value) '%';
position: absolute;
top: calc(50% - 0.5em);
left: 50%;
transform: translateX(-50%);
font-size: 300%;
font-family: DejaVu Sans Mono, monospace;
z-index: 3;
}
The HTML code is used to import all the classes created in CSS, in this part is where we set the sublasses of the CSS design
HTML CODE
<div class="master-container">
<div class="base_child"></div>
<div class="trapezoid_child"></div>
<div class="container_child">
<div class="quantity_child">50%</div>
</div>
<div class="leg_child_left"></div>
<div class="leg_child_right"></div>
<div class="inverted_trapezoid_child"></div>
</div>
Importing the design into Node-Red
Para implementar el diseño en Node-RED, usaremos el nodo template. Ábrelo e inserta el código CSS y HTML, estructurado de la siguiente manera.
<style>
CSS code
</style>
HTML code
Note: if "ui_template" is not found in node section you need to install "Node-red-dashboard" extension
Para probar el diseño, enviaremos valores al nodo template y observaremos cómo responde el indicador. Para esta prueba es necesario modificar algunos parámetros del código HTML.
<div class="master-container">
<div class="base_child"></div>
<div class="trapezoid_child"></div>
<div class="container_child">
<div class="quantity_child">{{msg.payload}}%</div>
<div class="liquid" style="height: {{msg.payload}}%; background-color: {{msg.payload > 75 ? '#00FF00' : (msg.payload > 50 ? '#FFFF00' : '#FF0000')}};"></div>
</div>
<div class="leg_child_left"></div>
<div class="leg_child_right"></div>
<div class="inverted_trapezoid_child"></div>
</div>
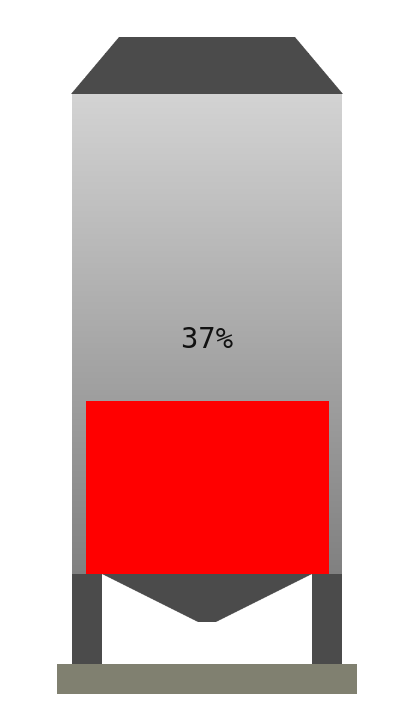
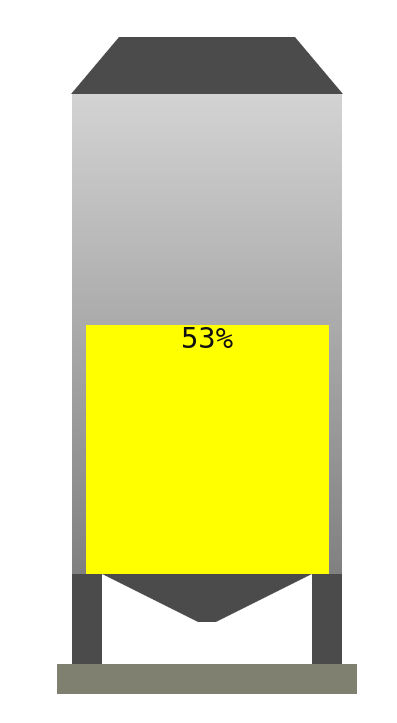
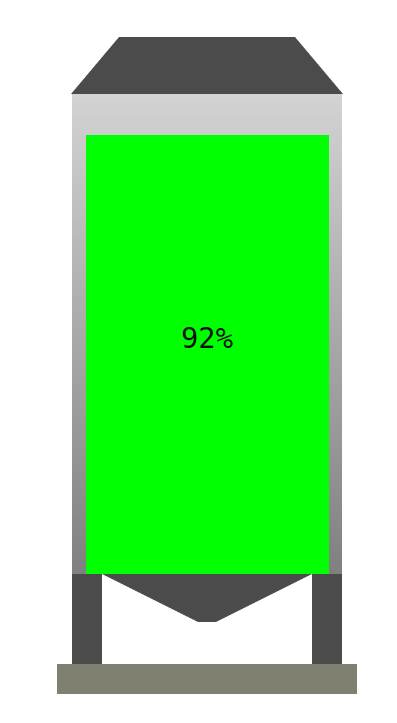
Como puedes ver, mostramos el payload que se envía al nodo template. El color del indicador cambia según el valor recibido: rojo si el porcentaje es inferior a 50, amarillo entre 51 y 75, y verde por encima de 75.
Para probar el template, vamos a configurar el siguiente flujo:
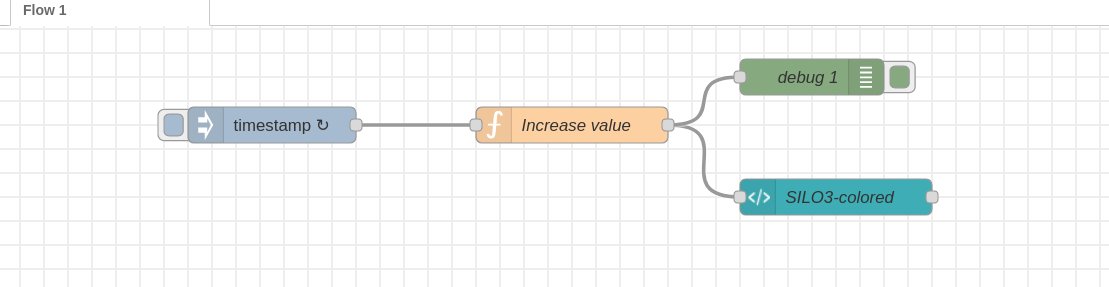
El flujo tiene los siguientes nodos:
- Inject node: set inject to be repeated every second
- Function node: this function will send a value as payload that is increased every injection time, the function values have a range [0-100]
- Template node: where our gauge design is implemented (needed to configure dashboard settings)
- [Opcional] Nodo Debug: para ver los valores enviados desde el nodo Function
Una vez implementado el flujo, despliega el proyecto y accede al dashboard para ver cómo funciona tu diseño.